
Trade the US earnings season
The Q1 2026 earnings season can move markets fast. Track upcoming earnings, plan your watchlist, and trade US share CFDs with tools built for active traders.

Most watched this season
Apple • Microsoft • Alphabet • Amazon • Nvidia • Meta • Tesla
Trade the US earnings season with GO Markets
The US earnings season brings a wave of earnings updates from major listed US companies. Results, guidance, and market expectations can shift quickly, driving volatility across individual stocks, sectors, and broader indices.
Competitive pricing
Stay cost-aware when trading around fast-moving reports.
Technical analysis tools
Use charts and indicators to plan entries, exits, and risk.
Built for active trading
Trade with fast execution and a reliable platform.
Risk management controls
Use built-in tools to define downside and protect positions during volatility.
More time to act
Extended hours are available on selected US share CFDs, giving you additional trading time beyond standard market sessions.*
*Availability varies by instrument. Trading conditions may differ outside regular market hours.

Most watched this season
US earnings calendar
Displayed times use Australian Eastern Standard Time (GMT+10). Change your timezone anytime in the Earnings Calendar settings.
News & analysis


If you have been watching markets over the past year, you will have noticed that the "growth at any cost" era has effectively hit a wall. The April 2026 earnings cycle arrives at a moment when the market's focus has undergone a structural reorientation. It is not just about profit and loss statements anymore. It is about the signals sitting behind them.
With interest rate uncertainty lingering and geopolitical shocks pushing oil above US$100, the playbook has shifted from AI hype toward institutional resilience and the industrialisation of compute. For traders in Australia, Asia and Latin America, these results may act as a mood ring for global risk appetite and the emerging security supercycle.

Why BMO and AMC matter
A BMO result hits before the US cash market opens, so price discovery happens in pre-market trading where liquidity is thinner and moves can be exaggerated. An AMC result hits after close, meaning the reaction is compressed into a short pre-market window the following morning. Understanding which window your company reports in is as important as understanding what it reports.
It's worth asking: Is the obvious trade already priced for perfection?
2026 is shaping up as a year of proof. Companies that spent heavily on AI over the past two years are now being asked to show the return. The market is no longer rewarding the announcement of AI investment. It is rewarding the evidence of AI-driven revenue outcomes.
A better framing question for each result is this: are you reacting to a headline, or are you assessing the company's role in the physical AI supply chain or as a potential volatility hedge? Those are very different analytical tasks, and they tend to produce very different positioning decisions.

Expected earnings date: Wednesday, 25 February 2026 (US, after market close) / ~8:00 am, Thursday, 26 February 2026 (AEDT)
NVIDIA’s upcoming earnings release is expected to revolve around data centre revenue growth, the sustainability of AI-related demand, gross margin trajectory, and forward guidance into fiscal year 2027 (FY2027).
Markets are likely to focus on capital expenditure trends, supply capacity, and management’s AI infrastructure outlook.
Some market participants may also view NVIDIA’s results as a useful signal for broader AI-related investment sentiment, although outcomes can still be influenced by company-specific factors and wider market conditions.
Key areas in focus
Data centre (AI chips)
The data centre segment continues to be NVIDIA’s primary growth driver. Markets are likely to monitor revenue growth rates, gross margins, and guidance around AI accelerator demand.
Gaming
NVIDIA also sells graphics cards for gaming PCs. Markets will watch whether this part of the business remains steady and profitable, particularly alongside broader consumer and PC-cycle trends.
Automotive and Professional Visualisation
These are smaller divisions linked to AI development, design software and autonomous driving. They are not typically the main driver of near-term results, but commentary may be watched for signs of longer-term growth and product momentum.
Profit margins and costs
Markets will assess how profitable NVIDIA remains, particularly as AI-related investment and supply scaling continue. Margins are one factor closely watched alongside revenue growth, guidance, and broader risk sentiment.
What happened last quarter
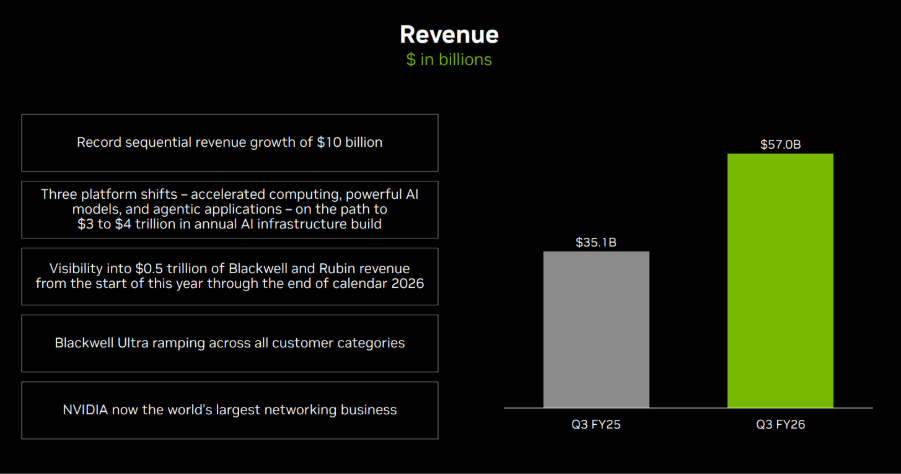
In its most recent quarterly update, NVIDIA reported strong year-on-year revenue growth, led primarily by data centre demand.
Management commentary and subsequent reporting referenced ongoing strength in AI accelerator demand and referenced continued supply-scaling initiatives.
Last earnings key highlights
- Revenue: US$57.0 billion
- Earnings per share (EPS): US$1.30 (diluted)
- Data centre revenue: US$51.2 billion
- Gross margin: 73.4%
- Operating income: US$36.0 billion
What analysts expect this quarter
Bloomberg consensus estimates point to continued year-on-year revenue growth in the upcoming report, with markets focused on data centre performance and forward guidance into FY2027.
Bloomberg consensus reference point:
- EPS: about US$1.52
- Revenue: about US$65.5 billion
- Full-year FY2027 EPS: about US$7.66
*All above points observed as of 16 February 2026.
Analysts broadly expect sustained AI-related demand, while attention remains on supply dynamics and the pace of any demand normalisation.
Market-implied expectations
Listed options were pricing an indicative move of approximately ±7% to ±8% around the earnings release, based on near-dated, at-the-money (ATM) options-implied expected-move estimates. Implied volatility was approximately 48% annualised.
What this means for Australian investors
NVIDIA’s earnings may influence near-term sentiment and volatility across major US equity indices, including the NASDAQ 100, with potential spillover into the Asia session following the release.
It may also influence sentiment toward ASX-listed technology-exposed companies and ETFs with exposure to US large-cap growth sectors, although correlations can shift quickly around major events.
Australian-based investors may also wish to factor in AUD/USD currency moves, which can affect the local-currency translation of offshore equities and ETFs.
Important risk note
Immediately after the US close and into the early Asia session, Nasdaq 100 (NDX) futures and related CFD pricing can reflect thinner liquidity, wider spreads, and sharper repricing around new information.
Such an environment can increase gap risk and execution uncertainty relative to regular-hours conditions.

Expected earnings date: Wednesday, 4 February 2026 (US, after market close) / ~8:00 am, Thursday, 5 February 2026 (AEDT)
Alphabet’s earnings provide insight into global digital advertising demand, enterprise cloud spending, and broader technology-sector investment trends.
As Google Search and YouTube are widely used by both consumers and businesses, results are often used as one input when assessing online activity and corporate marketing budgets, alongside other indicators.
Key areas in focus
Search
Search advertising remains Alphabet’s largest revenue driver. Markets are likely to focus on ad growth rates, pricing metrics such as cost-per-click, and overall advertiser demand across sectors such as retail, travel, and small-to-medium businesses.
YouTube
YouTube contributes to both advertising and subscription revenue. Markets commonly monitor advertising momentum, engagement trends, and monetisation developments as indicators of digital media conditions and brand spending.
Google Cloud
Sustained Cloud profitability is often discussed as a factor that may influence longer-term earnings expectations, though outcomes remain uncertain. Markets are expected to focus on revenue growth, enterprise adoption trends, and operating margins.
Other bets
Initiatives such as autonomous driving and life sciences, while typically smaller contributors to revenue, markets may still watch spending levels and progress updates as indicators of capital allocation and cost discipline.
Cost and margin framework
Management has previously flagged elevated capex tied to AI infrastructure, including data centres, specialised chips, and computing capacity. Traffic acquisition costs, staffing levels, and infrastructure expansion are also key variables influencing profitability.
What happened last quarter
Alphabet’s most recent quarterly update highlighted advertising trends, Cloud profitability, and continued increases in capex to support AI initiatives.
Management commentary has indicated that infrastructure spending is intended to support long-term competitiveness, while the market continues to assess the near-term margin trade-offs.
Last earnings key highlights
For reported figures and segment detail from the most recent quarter, refer to Alphabet’s latest earnings release materials, including revenue, earnings per share (EPS), Services mix, Cloud operating income, and capex commentary.
- Revenue: US$102.35 billion
- EPS: US$2.87
- Operating income: US$31.23 billion
- Services revenue: US$87.05 billion
- Cloud revenue: US$15.16 billion
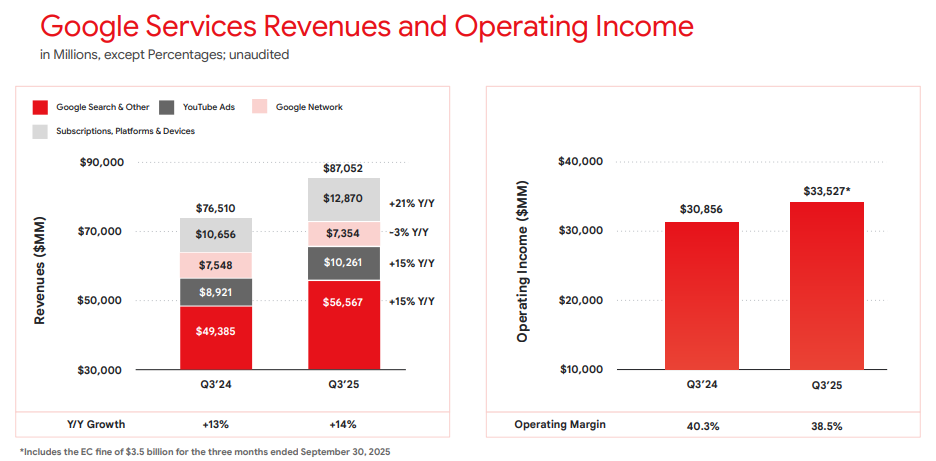
Google Services revenues and operating income Q3 2025 | Alphabet earnings release
What’s expected this quarter
Bloomberg consensus estimates moderate year-on-year (YoY) revenue growth and higher EPS versus the prior-year quarter, with ongoing focus on operating margins given AI-related investment.
Bloomberg consensus reference points:
- EPS: low-to-mid US$2 range
- Revenue: high US$80 billion to low US$90 billion range
- Capex: expected to remain elevated
*All above points observed as of 31 January 2026.
Market-implied expectations
Listed options implied an indicative expected move of around ±4% to ±6% over the relevant near-dated expiry window. Movements derived from option prices observed at 11:00 am AEDT, 2 February 2026.
These are market-implied estimates and may change. Actual post-earnings price moves can be larger or smaller.
What this means for Australian market participants
Alphabet’s earnings can influence near-term sentiment across major US equity indices, particularly Nasdaq-linked products, with potential spillover into the Asia session following the release.
Important risk note
Immediately after the US close and into the early Asia session, Nasdaq 100 (NDX) futures and related CFD pricing can reflect thinner liquidity, wider spreads, and sharper repricing around new information.
Such an environment can increase gap risk and execution uncertainty relative to regular-hours conditions.

Expected earnings date: Thursday, 5 February 2026 (US, after market close)/early Friday, 6 February 2026
Amazon’s earnings provide insight into global consumer spending trends, cloud infrastructure demand, and the monetisation of its ecosystem across retail, advertising, and subscription services.
Focus is expected to remain on performance across key business areas, along with commentary on cost efficiency, capital expenditure, and AI-related investments, including data centre expansion.
Key areas in focus
Online stores and third-party services
Amazon’s core retail business remains sensitive to discretionary consumer demand, particularly through the December-quarter holiday period. Markets are likely to focus on revenue growth and margins across both first-party retail and third-party seller services. Cost pressures will also be evaluated.
AWS (Amazon Web Services)
AWS is a key earnings driver. Investors are likely to focus on revenue growth rates, margin trends, and indications around enterprise cloud spending. AI workloads will also be noteworthy. Any commentary on capacity expansion and capex is likely to be closely watched.
Advertising services
Amazon’s advertising business has become an increasingly important profit contributor. Markets are likely to assess growth momentum, advertiser demand, and how advertising integrates across Amazon’s retail and Prime ecosystems.
Subscription services (including Prime)
Subscription revenue includes Prime memberships and related digital services. Investors may watch engagement, pricing dynamics, and retention trends as indicators of ecosystem strength.
Cost and margin framework
Management has previously emphasised the need for cost discipline across fulfilment, logistics, and corporate expenses. Reported operating margins and any updates on efficiency gains or reinvestment priorities across key business services will be of interest.
What happened last quarter
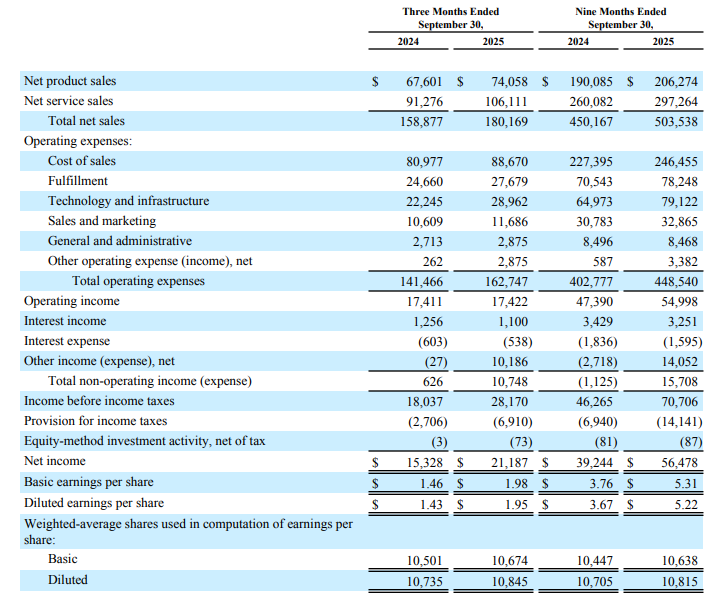
Amazon’s most recent quarterly update reported revenue growth and operating income outcomes, with AWS and advertising referenced as key contributors, alongside ongoing cost-control measures across the retail business.
The prior update also included discussion relevant to investment priorities in cloud and AI infrastructure, which continue to influence market expectations.
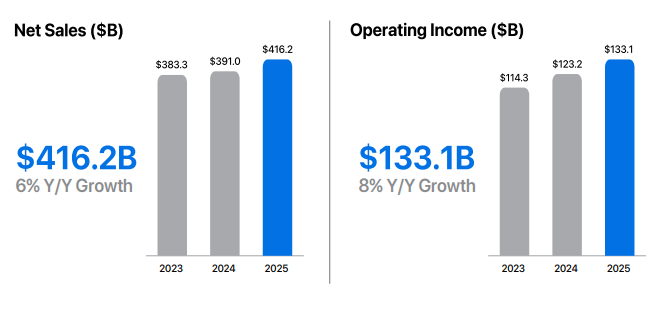
Last earnings key highlights
- Revenue: US$180.2 billion
- Earnings per share (EPS): US$1.95 (diluted)
- AWS revenue: US$33.0 billion
- Advertising services revenue: US$17.7 billion
- Operating income: US$17.4 billion
How the market reacted last time
Amazon shares moved higher in after-hours trading following the previous release, based on reporting at the time.
What’s expected this quarter
Bloomberg consensus estimates point to year-on-year EPS growth for the quarter ended December 2025, with markets focused on the revenue outcome, operating margins, and AWS performance, given the importance of the December quarter (Q4) to Amazon’s earnings profile.
Bloomberg consensus reference points (January 2026):
- EPS: about US$1.60
- Revenue: about US$170 billion
- Full-year FY2026 EPS: about US$5.10
*All above points observed as of 27 January 2026.
Expectations
Market sentiment around Amazon may be sensitive to any disappointment in AWS growth, operating margins, or December-quarter (Q4 2025) retail performance, given the stock’s large index weighting within major US equity indices and its role in these areas.
Listed options were pricing an indicative move of around ±4% to ±5% based on near-dated, at-the-money options-implied expected move estimates observed on Barchart at 11:00 am AEDT, 28 January 2026.
Implied volatility was approximately 32% annualised at that time.
These are market-implied estimates (not a forecast) and may change. Actual post-earnings price moves can be larger or smaller.
What this means for Australian investors
Amazon’s earnings can influence near-term sentiment across major US equity indices, with potential spillover into the Asia session following the release. It may also influence sentiment towards ASX-listed companies with significant online sales exposure.
Important risk note
Immediately after the US close and into the early Asia session, Nasdaq 100 (NDX) futures and related CFD pricing can reflect thinner liquidity, wider spreads, and sharper repricing around new information.
Such an environment can increase gap risk and execution uncertainty relative to regular-hours conditions.

Expected earnings date: Thursday, 29 January 2026 (US, after market close) / early Friday, 30 January 2026 (AEDT)
Key areas in focus
iPhone
The iPhone remains Apple’s largest revenue driver. Markets are likely to focus on unit demand, product mix (including higher-end models), and any signals on upgrade momentum and regional trends.
Services
Investors are likely to focus on growth across areas such as the App Store, iCloud, Apple Music and other subscriptions, alongside any commentary on average revenue per user (ARPU). The size and engagement of Apple’s installed base remain central to overall performance.
Wearables, home and accessories
This segment includes products such as Apple Watch, AirPods, Beats headphones, home-related devices, and accessories. Investors are likely to watch revenue trends in this segment as an indicator of discretionary consumer demand.
Cost and margin framework
Management has flagged tariff and component cost pressures in prior commentary. Markets may remain sensitive to gross margin commentary and any signals of incremental cost pressure or mitigation strategies.
What happened last quarter
Apple’s most recent quarterly update (fiscal Q4 2025) highlighted record September-quarter revenue and EPS, alongside record Services revenue and continued emphasis on installed-base strength.
The prior update also included discussion of holiday-quarter expectations and cost headwinds (including tariffs), which have influenced expected margins and management guidance.
Last earnings key highlights
- Revenue: US$102.5 billion
- Earnings per share (EPS): US$1.85 (diluted)
- iPhone revenue: US$49.03 billion
- Services revenue: US$28.75 billion
- Net income: US$27.5 billion
How the market reacted last time
Apple shares rose in after-hours trading following the release, as investors assessed the results against analyst expectations and management’s holiday-quarter commentary, including tariff-related cost pressures and regional demand considerations.
What’s expected this quarter
Bloomberg consensus points to year-on-year EPS growth, with markets also focused on the revenue outcome and gross margins, given the scale and importance of the holiday quarter for Apple’s earnings profile.
Bloomberg consensus reference points (January 2026):
- EPS: about US$2.65
- Revenue: about US$138 billion
- Full-year FY2026 EPS: about US$8.1
*All above points observed as of 26 January 2026.
Expectations
Sentiment around Apple may be sensitive to any disappointment on holiday-quarter revenue, Services momentum, or margin commentary, given the stock’s large index weight and the importance of this reporting period.
Listed options were implying an indicative move of around ±3% to ±4% based on near-dated, at-the-money options-implied expected move estimates observed on Barchart at 11:00 am AEDT on 25 January 2026. Implied volatility was approximately 29% annualised at that time.
These are market-implied estimates (not a forecast) and may change. Actual post-earnings price moves can be larger or smaller.
What this means for Australian traders
Apple’s earnings can influence near-term sentiment across major US equity indices, particularly Nasdaq-linked products, with potential spillover into the Asia session following the release.
Important risk note
Immediately after the US close and into the early Asia session, Nasdaq 100 (NDX) futures and related CFD pricing can reflect thinner liquidity, wider spreads, and sharper repricing around new information.
Such an environment can increase gap risk and execution uncertainty relative to regular-hours conditions.

Expected earnings date: Wednesday, 28 January 2026 (US, after market close) / early Thursday, 29 January 2026 (AEDT)
Key areas in focus
The Tesla earnings release can act as a barometer for both global EV demand and capital-intensive innovation across automation and energy systems.
Vehicle deliveries and margins are likely to be the primary near-term drivers of sentiment. Investors will also be watching updates across adjacent initiatives that may influence longer-term growth expectations.
Autonomy and software (FSD)
Tesla’s “Full Self-Driving” (FSD) is a branded advanced driver-assistance feature sold in some markets and requires active driver supervision; availability and capabilities vary by jurisdiction.
Further rollout and any expansion of autonomy-linked services remain subject to regulatory approvals and continued evolution of the underlying technology.
Energy generation and storage
Solar, Powerwall and Megapack remain a key focus, particularly given the segment’s recent growth contribution.
Robotics (Optimus)
Optimus remains early stage, with no disclosed revenue contribution to date. It may become more relevant to Tesla’s longer-term AI and automation aspirations.
Expectations remain delicately balanced between near-term margin pressure, the impact of demand and interest rate movements, and longer-term product and platform developments.
What happened last quarter?
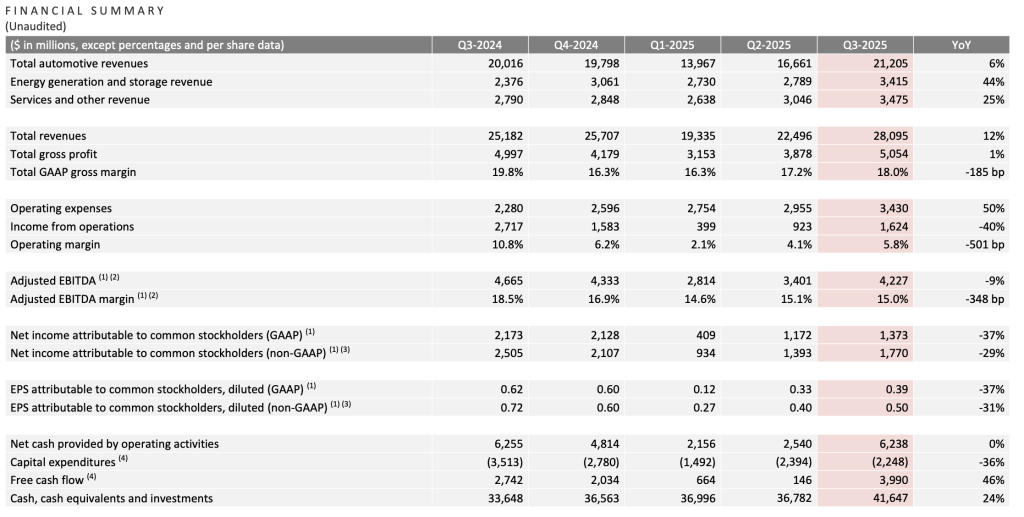
In Q3 2025 (September quarter), Tesla reported mixed results versus consensus expectations. Revenue and deliveries reached record levels, while earnings and margins remained under pressure amid pricing and cost dynamics.
Tesla said it was navigating a challenging pricing environment while continuing to invest for long-term growth (as referenced in the shareholder communications cited below).
Last earnings key highlights
- Revenue: ~US$28.1 billion
- Earnings per share (EPS): ~US$0.50 (non-GAAP, diluted)
- Total GAAP gross margin: ~18.0%;
- Operating margin: ~5.8%
- Free cash flow (FCF): ~US$4.0 billion
- Vehicle deliveries: ~497,099 units, up ~7% year on year (YoY)
How did the market react last time?
Tesla shares were volatile in after-hours trading, with attention focused on margins relative to revenue.
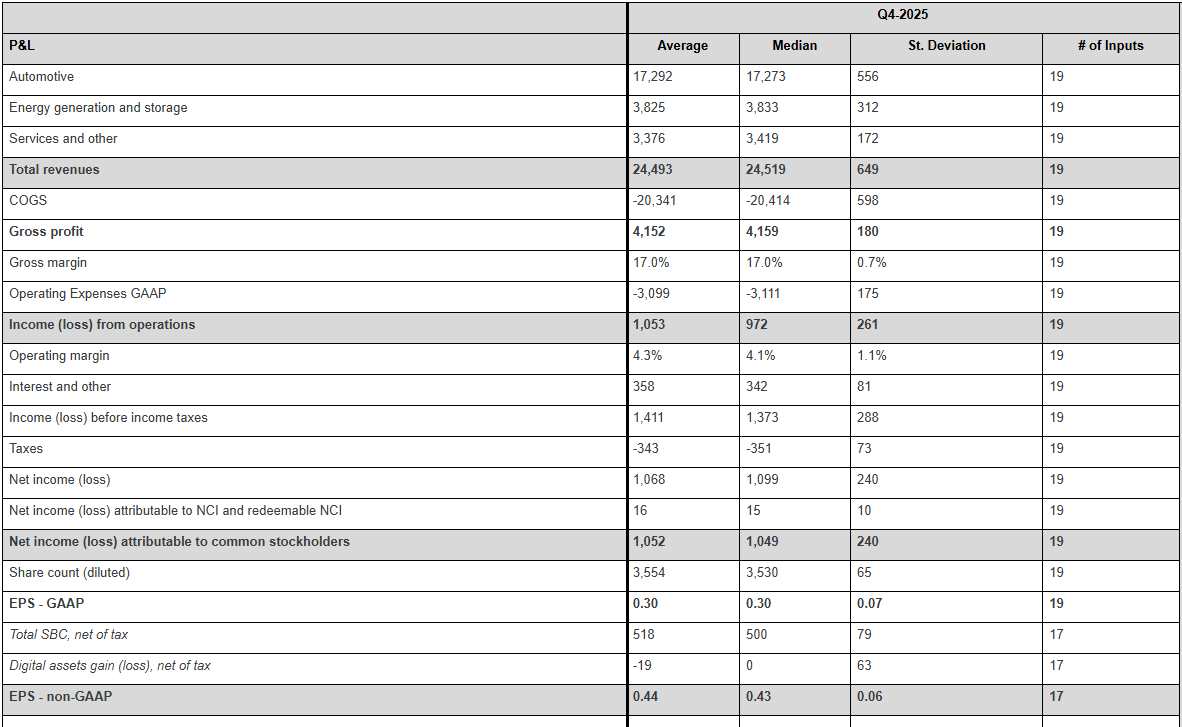
What’s expected this quarter?
As of mid-January 2026, third-party consensus estimates (Bloomberg) indicated continued focus on revenue growth alongside profitability and margin resilience. These are third-party estimates, not company guidance, and can change.
Key consensus reference points include:
- Revenue: market expectations ~US$27 billion to US$28 billion
- EPS: consensus clustered near US$0.55 to US$0.60 (adjusted)
- Deliveries: market estimates ~510,000 to 520,000 vehicles
- Margins: focus on whether automotive gross margin stabilises near recent levels or trends lower
- Capital expenditure (capex): focus on spending discipline and efficiency rather than acceleration
*All above points observed as of 16 January 2026.
Key areas markets often focus on include:
- Profit margin trajectory, and whether cost efficiencies are offsetting pricing pressure
- Delivery volumes relative to consensus expectations
- Pricing strategy and evidence of demand elasticity across regions
- Capex and implications for future FCF
- Progress in energy storage and non-automotive revenue streams
- Commentary on AI, autonomy and longer-term investment priorities
Expectations
Market sentiment could be described as cautiously optimistic, with investors weighing revenue momentum against margin concerns.
Price has pulled back into a range following a brief test of recent highs in December. Given the recent range-bound price action, deviations from consensus across key earnings metrics may prompt a larger move in either direction.
Listed options were pricing an indicative move of around ±5.5% based on near-dated options expiring after 28 January and an at-the-money (ATM) options-implied expected move estimate.
Implied volatility (IV) was about 47.7% annualised into the event, as observed on Barchart at 11:30 am AEDT on 16 January 2026 (local time of observation).
These are market-implied estimates and may change. Actual post-earnings moves can be larger or smaller.
What this means for Australian traders
Tesla’s earnings may influence near-term sentiment across US growth and technology indices, with potential flow-through to broader risk appetite.
For Australian markets, any read-through is often framed through supply chain sensitivity. Market participants may look to related sectors such as lithium and rare earth producers linked to EV inputs are one potential channel, alongside broader sentiment impacts from Tesla’s innovation commentary.
Important risk note
Immediately after the US close and into the early Asia session, Nasdaq 100 (NDX) futures and related CFD pricing can reflect thinner liquidity, wider spreads, and sharper repricing around new information.
Such an environment can increase gap risk and execution uncertainty relative to regular-hours conditions.