Is it time to Capitalise on Short Squeezes ? Short Squeezes are one of the interesting price action patterns that can occur in the market. They can provide It can provide explosive momentum trading opportunities that can go on for days.
They can provide trading opportunities for scalpers, intraday, and swing traders. What actually is a short squeeze and why do they occur? To understand a short squeeze it is important to go back to the basics of trading and understand what an actual short is and why market participants go short on a product.
What is a short? A short is a position that a market participant takes when they expect the price of a market product to go down. This can include but is not excluded too, Securities, Commodities and Forex.
A trader may take a short position because they believe a company is overvalued, a currency will go down in value due to economic factors, to hedge or for a number of other reasons. Short positions can be taken in a range of ways, however, the most common method for shorting a CFD is quite simple. It involves borrowing units to sell with the short holder having to buy-back the units at a lower price and pocketing the difference.
Example A trader believes that company ABC is overvalued at $1.00 and decides to borrow 100 CFD units of ABC to short at $1.00 per CFD with a total value of $100. The price then falls to $0.50. The trader closes their position and buys back the CFDs at $50.
They are then able to pocket the difference of $50.00. The mechanics of a short squeeze. Due to the nature of a short position which requires a buying back of the stock to both close the position and lock in profit a trader will inevitably have to buy-back or close their position at some point.
This subsequently drives up the price. Most of the time in a trending market this process works without any issues. However, if the price stops falling and consolidates or to a stage where the market starts to see value in the price again, large short holders may decide to close out their position.
If big positions or institutions close all at once it can create an avalanche effect. Indicators of a short squeeze A stock, currency, or commodity that is highly shorted or is overextended to the sell side is often ripe for a squeeze. In addition, if the underlying asset is getting closer to an area of support or resistance it may show that the selling has dried up.
Shorters may then need to close their positions soon otherwise they risk holding losing positions If a stock is bottoming or basing it may indicate that buyers are beginning to take control of the price again. This shows that the asset has reached a point where it really can’t fall any further in price because buyers see too much value. A shift in the relative volume can indicate that either a big position is closing or buyers have found an area of value and that the price might be ready to reverse.
The large volume can also indicate that an institution is playing an active role in the price. It is usually good practice to follow where the big money is when trading. Squeezing in the current market A short squeeze can represent a great opportunity to profit for traders.
They can often be explosive moves and last for days. This means that whether you are a swing trader, day trader, or a scalper anyone can capitalise on a squeeze. In addition, with the current state of the market having one of its worst first half of the years in history, with bearish sentiment being very high.
The Nasdaq in particular and growth stocks in particular have seen their value smashed. As big short positions have been taken at some stage they will have to be closed and if the market can rally, then this phenomenon may become more regular. For instance the company ZIP a strong player in the Buy Now Player Sector had seen its share priced reduced to a fraction of its peak prior to just a few weeks ago.
However as seen in the chart below, a shift in volume was the first signal that the stock was about squeeze and shift strongly to the upside. In this instance, ZIP on the weekly chart saw a massive jump in volume, followed by an even larger jump in volume the following week. Importantly ZIP, according to (Shortman.com.au) had a short % of 7.34 on July 1 2022, prior to the breakout.
Looking at the daily chart underneath, the sheer volume of buying continued to get larger and larger which is indictive of a short squeeze as large positions began to close. The subsequent price action provided great consistent buying opportunities for traders.
By
GO Markets
Disclaimer: Articles are from GO Markets analysts and contributors and are based on their independent analysis or personal experiences. Views, opinions or trading styles expressed are their own, and should not be taken as either representative of or shared by GO Markets. Advice, if any, is of a ‘general’ nature and not based on your personal objectives, financial situation or needs. Consider how appropriate the advice, if any, is to your objectives, financial situation and needs, before acting on the advice. If the advice relates to acquiring a particular financial product, you should obtain our Disclosure Statement (DS) and other legal documents available on our website for that product before making any decisions.
If you've spent any time looking at a trading terminal, you've seen it. A news headline breaks, a chart line snaps, and suddenly everyone is rushing for the same exit or the same entrance. It looks like chaos. In practice, it is often a chain of mechanical responses.
This matters for a couple of reasons. Many readers assume the story is the trade. It is not. The story, whether it is an interest rate decision, a supply shock or an earnings miss, is the fuel and the playbook is the engine.
Below are seven core strategies often used in contracts for difference (CFDs) trading. With CFDs, you are not buying the underlying asset. You are speculating on the change in value. That means a trader can take a long position if the price rises, or a short position if it falls.
Seven strategies to understand first
1. Trend following (the establishment play)
Trend following works on the idea that a market already in motion can remain in motion until it meets a clear structural obstacle. Some market participants view it as a chart-based approach because it focuses on the prevailing direction rather than trying to call an exact turning point.
The rationale: The aim is to identify a clear directional bias, such as higher highs and higher lows, and follow that momentum rather than position against it.
What traders look for: Exponential moving averages (EMAs), such as the 50-day or 200-day EMA, are commonly used to interpret trend strength, though indicators can produce false signals and are not reliable on their own.
Source: GO Markets | Educational example only.
How it works: The 50-period EMA can act as a dynamic support level that rises as price rises. In an uptrend, some traders watch for the market to make a new higher high (HH), then pull back towards the EMA before moving higher again. Each higher low (HL) may suggest buyers are still in control.
When price touches or comes close to the 50-period EMA during that pullback, some traders treat that area as a potential decision zone rather than assuming the trend will resume automatically.
What to watch: The sequence of HHs and HLs is part of the structural evidence of a trend. If that sequence breaks, for example if price falls below the previous HL, the trend may be weakening and the setup may no longer hold.
2. Range trading (the ping-pong play)
Markets can spend long stretches moving sideways. That creates a range, where buyers and sellers are in temporary balance. Range trading is built around this behaviour, focusing on moves near the bottom and top of an established range.
The rationale: Price moves between a floor, known as support, and a ceiling, known as resistance. Moves near those boundaries can help define the width of the range.
What traders look for: Some traders use oscillators such as the Relative Strength Index (RSI) to help judge whether the asset looks overbought or oversold near each boundary.
Source: GO Markets | Educational example only.
How it works: The support level is a price zone where buying interest has historically been strong enough to stop the market from falling further. The resistance level is where selling pressure has historically prevented further gains.
When price approaches support, some traders look for signs of a potential rebound. When it approaches resistance, they look for signs that momentum may be fading. RSI readings below 35 can suggest the market is oversold near support, while readings above 65 can suggest it is overbought near resistance.
What to watch: The main risk in range trading is a breakout, when price pushes decisively through either level with strong momentum. This may signal the start of a new trend and using a stop-loss just outside the range on each trade may help manage that risk.
3. Breakouts (the coiled spring play)
Eventually, every range comes under pressure. A breakout happens when the balance shifts and price pushes through support or resistance. Markets alternate between periods of low volatility, where price moves sideways in a tight range, and high-volatility bursts where price can make a larger directional move.
The rationale: Quiet consolidation can sometimes be followed by a broader expansion in volatility. The tighter the compression, the more energy may be stored for the next move.
What traders look for: Bollinger Bands are often used to interpret changes in volatility. When the bands tighten, a squeeze is forming. Some market participants view a move outside the bands as a sign that conditions may be changing.
Source: GO Markets | Educational example only.
How it works: Bollinger Bands consist of a middle line, the 20-period moving average, and 2 outer bands that expand or contract based on recent price volatility. When the bands narrow and come close together, the squeeze, the market has been unusually calm.
This is often described as a coiled spring. Energy may be building, and a sharper move can follow. Some traders treat the first move through an outer band as an early clue on direction, rather than a definitive signal on its own.
What to watch: Not every squeeze leads to a powerful breakout. A false breakout occurs when price briefly moves outside a band, then quickly reverses back inside. Waiting for the candle to close outside the band, rather than entering mid-candle, can reduce the risk of being caught in a false move.
4. News trading (the deviation play)
This is event-driven trading. The focus is on the gap between what the market expected and what the data or headline actually delivered. Economic data releases, such as inflation figures (CPI), employment reports and central bank decisions, can cause sharp, fast moves in financial markets.
The rationale: High-impact releases, such as inflation data or central bank decisions, can force a fast repricing of assets. The bigger the surprise relative to expectations, the larger the move may be.
What traders look for: Traders often use an economic calendar to track timing. Some focus on how the market behaves after the initial reaction, rather than treating the first move as definitive.
Source: GO Markets | Educational example only.
How it works: Before the news, price may move in a calm, tight range as traders wait. When the data is released, if the actual reading differs significantly from the consensus expectation, repricing can happen fast.
Gold, for example, may spike sharply on a CPI reading that comes in above expectations. However, the candle can also print a very long upper wick, meaning price reached the spike high but was then rejected strongly. Sellers may step in quickly, and price may retrace. This spike-and-retrace pattern is one of the more recognisable setups in news trading.
What to watch: The direction and size of the initial spike do not always tell the full story. Wick length can offer an important clue. A long wick may suggest the initial move was rejected, while shorter wicks after a data release may indicate a more sustained directional move.
5. Mean reversion (the rubber-band play)
Prices can sometimes move too far, too fast. Mean reversion is built on the idea that an overextended move may drift back towards its historical average, like a rubber band pulled too tight, then snapping back.
The rationale: This is a contrarian approach. It looks for stretches of optimism or pessimism that may not be sustainable, and positions for a return to equilibrium.
What traders look for: A common example is price moving well away from a 20-day moving average (MA) while RSI also reaches an extreme reading. In that setup, traders watch for a move back towards the mean rather than a continuation away from it.
Source: GO Markets | Educational example only.
How it works: The 20-period MA represents the market's recent average price. When price moves into an extreme zone, such as more than 3 standard deviations above or below that average, it has moved a long way from its recent trend.
An RSI above 70 can suggest the market is stretched to the upside, while below 30 can suggest the same to the downside. Some mean reversion traders use these combined signals as a sign that a pullback towards the 20-period MA may be possible, rather than assuming the move will continue to extend.
What to watch: Mean reversion strategies can carry significant risk in strongly trending markets. A market can remain extended for longer than expected, and a position entered against the short-term trend can generate large drawdowns. Position sizing and clear stop-losses are critical.
6. Psychological levels (the big figure play)
Markets are driven by people, and people tend to focus on round numbers. US$100, US$2,000 or parity at 1.000 on a currency pair can act as magnets. In financial markets, certain price levels can attract a disproportionate amount of buying and selling activity, not because of technical analysis alone, but because of human psychology.
The rationale: Large orders, stop-losses and take-profit levels can cluster around these big figures, which may reinforce support or resistance. This self-reinforcing behaviour is one reason these rejections can become meaningful for traders.
What traders look for: Traders often watch how price behaves as it approaches a round number. The market may hesitate, reject the level or break through it with momentum. Multiple wick rejections at the same level may carry more weight than a single one.
Source: GO Markets | Educational example only.
How it works: When price approaches a round number from below, some traders watch for long upper wicks, the thin vertical line above the candle body. A long upper wick means price reached that level, but sellers stepped in aggressively and pushed it back down before the candle closed.
One wick rejection may be notable. Three in a cluster may be more significant. Some traders use this accumulated rejection as part of the case for a short (sell) setup at that level.
What to watch: Psychological levels can also act as magnets in the opposite direction. If price breaks through with conviction, the level may then act as support. A decisive close above the level, rather than just a wick break, can be an early sign that the rejection setup is no longer holding.
7. Sector rotation (the economic season play)
This is a macro strategy. As the economic backdrop changes, capital may move from higher-growth sectors into more defensive ones, and back again. Not all parts of the sharemarket move in the same direction at the same time.
The rationale: In a slowing economy, discretionary spending may weaken while demand for essential services can remain more stable. Investors may rotate capital between sectors accordingly.
What traders look for: With CFDs, some traders express this view through relative strength, taking exposure to a stronger sector while reducing or offsetting exposure to a weaker one.
Source: GO Markets | Educational example only.
How it works: During a growth phase, when the economy is expanding, investors tend to prefer growth-oriented sectors like technology. As the economic environment shifts, perhaps due to rising interest rates, slowing earnings or increasing recession risk, a rotation point may emerge.
In the slowdown phase, the pattern can reverse. Technology may weaken while utilities may strengthen, as investors move capital into defensive, income-generating sectors. Early signals can include relative underperformance in growth sectors combined with unusual strength in defensives.
What to watch: Sector rotation is not usually an overnight event. It typically unfolds over weeks to months. Tracking the ratio between two sectors, often shown in a relative strength chart, can make this shift visible before it becomes obvious in absolute price terms.
Why risk management is the engine of survival
The headline move is one thing. The market implication for your account is another. If you do not manage the mechanics, the strategy does not matter.
Because CFDs are traded on margin, a small market move may have an outsized impact on the account. If leverage is too high, even a minor wobble may trigger a margin call or automatic position closure, depending on the provider's terms. This is not a theoretical risk. It is a common reason new traders lose more than they expected on a trade that was directionally correct.
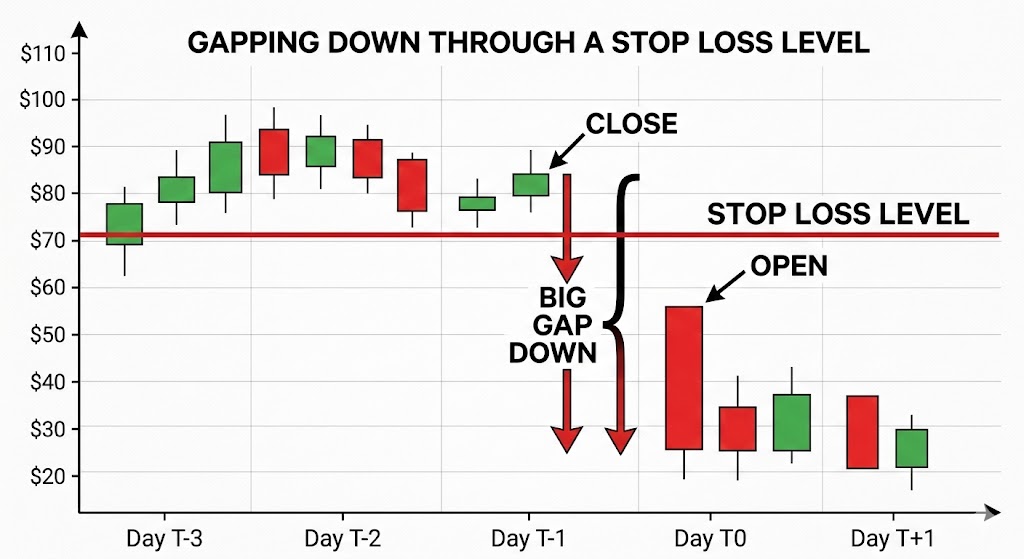
The market does not always move in a straight line. Sometimes, price gaps from one level to another, especially after a weekend or major news event and in those conditions, a stop-loss may not be filled at the exact requested price. That is known as slippage. It is one reason large positions may carry additional risk into major announcements.
Bottom line
The vehicle is powerful, but the playbook is what helps keep you on the road.
The obvious trade is often already priced in. What matters more is understanding which market condition is in front of you. Is it trending, ranging, breaking out or simply reacting to a headline?
Readers assessing leveraged products often focus on position sizing, risk limits and product disclosure before deciding whether the product is appropriate for them. The headlines will keep changing. The maths of risk management does not.
Disclaimer: This article is general information only and is intended for educational purposes. It explains common trading concepts and market behaviours and does not constitute financial product advice, a recommendation, or a trading signal. Any examples are illustrative only and do not take into account your objectives, financial situation or needs. CFDs are complex, leveraged products that carry a high level of risk. Before acting, consider the PDS and TMD and whether trading CFDs is appropriate for you. Seek independent advice if needed. Past performance is not a reliable indicator of future results.
One day the ASX is drifting quietly... and the next, margin requirements rise, stops do not fill where expected, and portfolios open with uncomfortable overnight gaps.
If you have been searching for answers, you are not alone. Some of the most searched questions about volatility among Australian traders relate to margin calls, slippage, overnight gaps, leveraged exchange traded funds (ETFs), and tools such as average true range (ATR).
Here is what is happening.
Why this matters now
Global markets have become more sensitive to interest rates, inflation data, geopolitics and technology-driven flows. When liquidity thins and uncertainty rises, price swings widen. That is volatility.
And volatility doesn’t just affect price direction, it changes how trades are executed, how much capital is required, and how risk behaves beneath the surface.
Translation: Volatility is not just about bigger moves, rather, it’s about faster moves and thinner liquidity - that’s when the mechanics of trading matter most.
One of the most searched questions about volatility is why margin requirements increase without warning.
When markets become unstable, brokers may increase margin requirements on contracts for difference (CFDs) and other leveraged products. Larger price swings can increase the risk of accounts moving into negative equity thus raising margin requirements reduces available leverage and can help manage exposure during extreme conditions.
What this can mean in practice
-A margin call may occur even if price has not moved significantly. -Effective leverage can drop quickly. -Positions may need to be reduced at short notice.
Margin adjustments are typically a response to changing market risk, not a random decision. In highly volatile markets, it is prudent to assume margin settings can change quickly, therefore many traders choose to review position sizes and available buffers in light of that risk.
What is slippage and why didn’t my stop fill at my price?
Another frequently searched topic is slippage.
Slippage can occur when a stop order triggers and is executed at the next available price, the outcome can depend on the order type, market liquidity and gaps. In calm markets, the difference may be small whereas in fast markets, prices can gap beyond the stop level.
Illustration of price gap through stop-loss level | GO Markets
Stop-loss orders generally prioritise execution rather than price certainty and during periods of high volatility, this distinction becomes important. Adjusting position size and placing stops with reference to typical price movement may be more effective than simply tightening stops in unstable conditions.
How do I manage overnight gapping on the ASX?
Australia trades while the United States sleeps, and vice versa. This time zone difference is, sadly, one reason overnight gap risk is frequently searched by Australian traders. If US markets fall sharply, the ASX may open lower the following morning, with no opportunity to exit between the close and the open.
Examples of risk-management approaches market traders may use include
-Index hedging using ASX 200 futures or CFDs*. -Partial hedging during high risk events. -Reducing exposure ahead of major macro announcements.
Hedging can offset part of a move, but it introduces basis risk as individual stocks may not move in line with the broader index.
There is no perfect protection, only trade-offs between cost, complexity and risk reduction.
*CFDs are complex instruments and come with a high risk of losing money due to leverage.
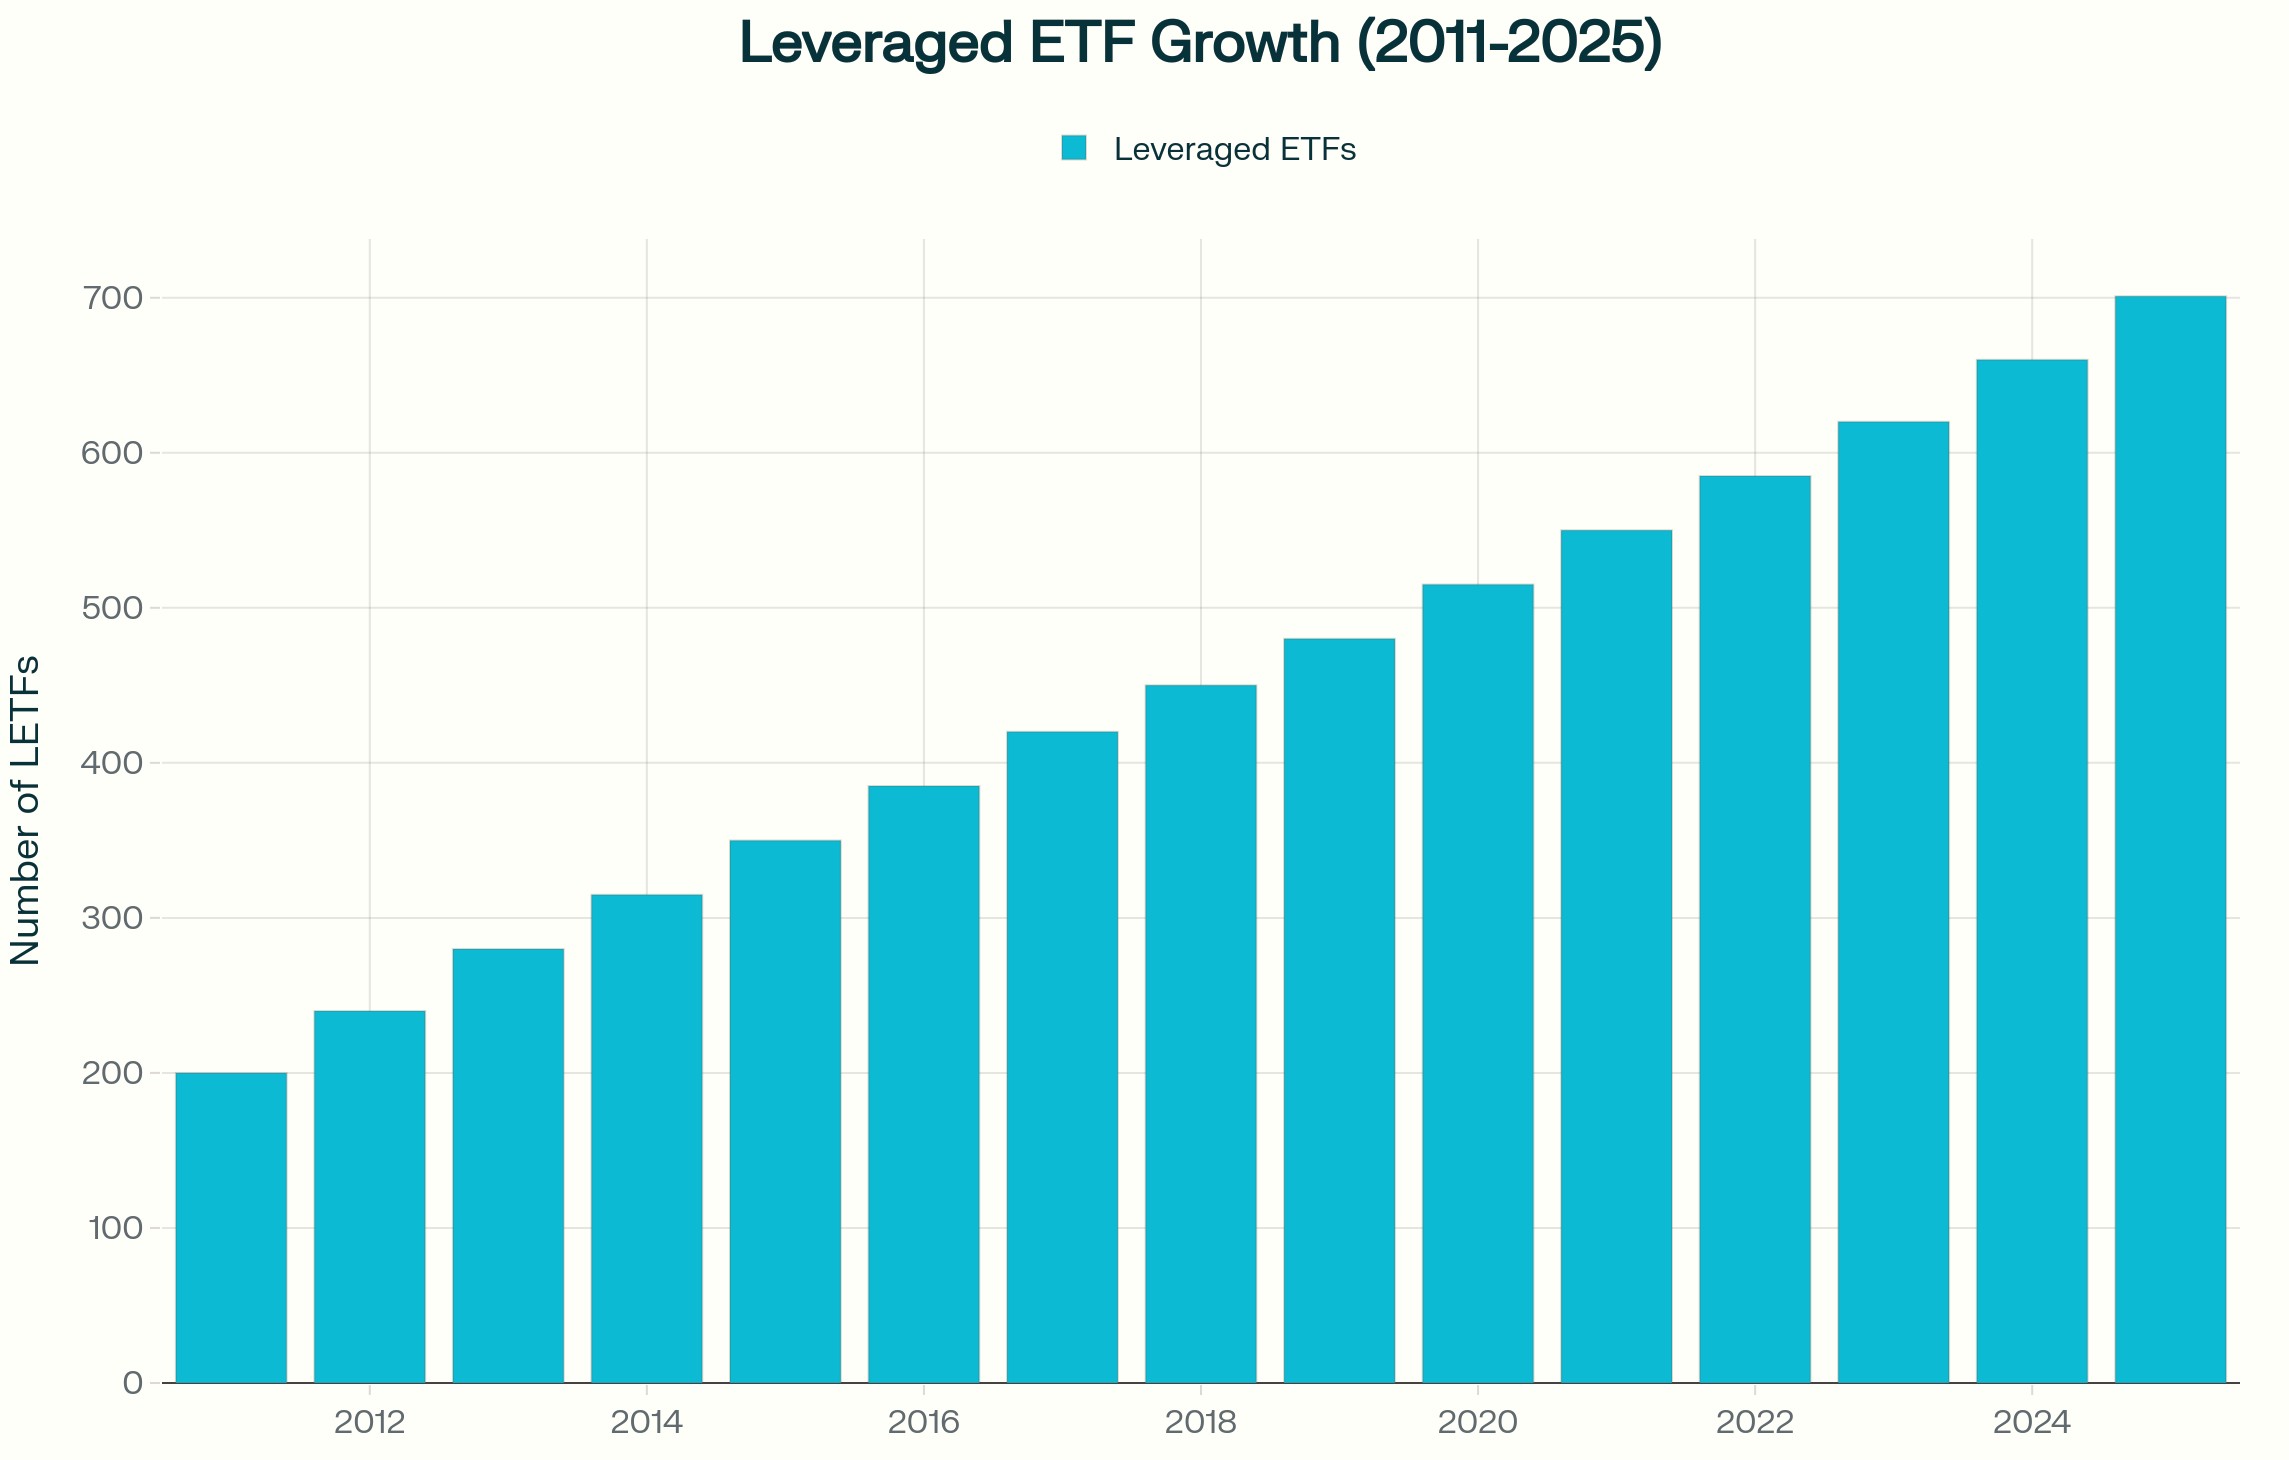
What are the key risks of leveraged or inverse ETFs in volatile markets?
Leveraged and inverse ETFs are often searched during periods of heightened volatility.
While these products typically reset daily, they aim to deliver a multiple of the index’s daily return, not its long-term return. In a volatile, sideways market, daily compounding can erode value even if the index finishes near its starting level.
This occurs because gains and losses compound asymmetrically. A fall of 10 percent requires a gain of more than 10 percent to recover. When that effect is multiplied daily, outcomes can diverge materially from the underlying index over time.
Such instruments may be used tactically by some market participants. They are generally not designed as long-term hedging tools and understanding their structure is essential before using them in a strategy.
How can ATR be used to inform stop placement?
Average true range (ATR) is a commonly used indicator for measuring volatility.
ATR estimates how much an asset typically moves over a given period, including gaps. Rather than setting a stop at an arbitrary percentage, some traders reference ATR and place stops at a multiple, such as two or three times ATR, to reflect prevailing conditions.
When volatility rises, ATR expands and that can imply wider stops or smaller position sizes if overall risk is to remain constant. The shift is from asking, “How far am I willing to lose?” to asking, “What is a normal move in current conditions?"
Practical considerations in volatile markets
During periods of elevated volatility, traders may consider
Allowing for the possibility of margin changes
Sizing positions conservatively if volatility increases
Recognising that stop-loss orders do not guarantee a specific exit price
Reviewing exposure ahead of major economic events
Understanding the daily reset mechanics of leveraged ETFs
Using volatility measures such as ATR to inform stop placement
Maintaining adequate cash buffers
Volatility does not reward prediction alone. Preparation and risk awareness may assist traders in understanding potential risks, but outcomes remain unpredictable.
Australian markets face specific structural considerations cpmapred to Asian and US Markets. Overnight gap risk is influenced by US trading hours and resource heavy indices such as the ASX can respond quickly to commodity price movements and data from China. Currency exposure, including AUD and US dollar (USD) moves, can add another layer of variability.
Volatility is not uniform across regions. It behaves differently depending on market structure and liquidity depth.
Frequently asked questions about volatility
What causes sudden spikes in market volatility? Interest rate decisions, inflation data, geopolitical developments, earnings surprises and liquidity constraints are common triggers.
Why do brokers increase margin during volatile markets? To reduce leverage exposure and manage risk when price swings widen.
Can stop-loss orders fail during volatility? They can experience slippage if markets gap beyond the stop level, meaning execution may occur at a worse price than expected. In fast or illiquid markets, this difference can be significant.
Are leveraged ETFs suitable for long term hedging? They are generally structured for short-term exposure due to daily resets. Whether they are appropriate depends on your objectives, financial situation and risk tolerance.
How can volatility be measured before placing a trade? Tools such as ATR, implied volatility indicators and historical range analysis can help quantify prevailing conditions.
Risk warning: Periods of heightened volatility can lead to rapid price movements, margin changes and execution at prices different from those expected. Risk-management tools such as stop-loss orders and volatility indicators may assist in assessing market conditions but cannot eliminate the risk of loss, particularly when using leveraged products.
We are less than three weeks away from the ASX earning season and we are less than two weeks away from the earnings season in the US. So, we need to start prepping for trades and opportunities now. First and foremost, do not forget that confession season is well and truly upon us here in Australia.
Downgrades clearly have been coming from the discretionary sector; we've even seen companies hit the wall with the likes of Booktopia going into administration. There are some clear thematics that are growing in the Australian market. Energy, while the worst performing sector for the financial year 2024, may actually show you that earnings were slightly above expectation on higher than expected oil prices.
Materials led in the main by BHP, Rio and FMG Have once again benefited from higher than expected iron ore prices. It also benefited from a lower than expected AUD/USD where average FX prices were expected to be between $0.68 and $0.73 but instead have averaged between $0.63 and $0.67. What we're looking for is operational costs, overall margins and forward looking guidance, something that these firms have lacked in the last three financial updates.
Watch very closely for the excitement that will come from things like copper at the expense of the issues that are facing nickel lithium and other transition metals that have had really tough periods in FY24. Moving to the banks this is a sector people argue is fully valued. It's not hard to argue when through the financial year CBA made record all time highs several times and is still within a whisker of its record all time high.
Higher interest rates will indeed improve net interest margins. However, the unknown question and what we need to see at its August full year earnings is the impact higher rates are having on bad and doubtful debts, the possible increase in provisioning and more importantly the impact its having on new loans and refinancing. There is an argument to be made that banking is possibly fully priced and no matter what result is delivered won't necessarily create a leg further higher.
Finally, you can't go past consumer staples and discretionary. Retail sales numbers over the last 18 months have actually shown discretionary spending At or above 2022 levels although month on month figures have been erratic. The question that will come for discretionary spending is margins and how much sales revenue translates to the bottom line in earnings and profit.
Staples on the other hand have seen consistent movement on the revenue line but the question will be the margin and after the very targeted senate inquiry into supermarkets any sign profits are above trend may actually be met with concern as geopolitics raises its head. 33 times in 2024 the US 500 and the Tech 100 have made record highs – can it continue? Look into the US and the ending season that it is about to undertake. We have to look at several core thematics that are likely to be raised.
Artificial Intelligence (AI) The question you’ve got to ask is: is the time frame long or short? We raised this Mag 7 stocks etc Microsoft, Amazon, Alphabet, apple have clear potential. They are evolving their business models and see the integration of AI as the future of their individual businesses.
That will likely come up in their numbers but it will come with operational and initial upfront costs as the integration of AI begins. This is all long term may not fully capture short term opportunities which is still presenting very much in the semiconductor providers. NVIDIA and Advanced Micro Devices are taking full advantage and monetizing the compute cycle.
This clearly won't be forever because it will go from semiconductors to infrastructure to software and therefore the flows will move back towards the bigger end of town but overall the AI thematic still flows towards the semiconductors for now and that's likely to be shown in the earnings season that's coming. Data Centres That brings us to data centres because the potential for ensuring AI requires a heck of a lot of storage and a heck of a lot of processing. There are estimates the data centres will need to grow by 420% in Europe and 250% in the US by 2035 based on the rate of growth in AI right now.
Therefore, we need to watch providers like Dell Technologies and Intel which are big providers of data centres currently. We think the market hasn’t fully appreciated DC needs in the AI revolution. Cybersecurity The final key theme in the AI data centre technology space that we also think needs to be watched is cyber security.
It's been something along the lines of a 70% increase in ransomware attacks over the past 24 months. The regulatory requirements and the budgets required to deal with these increased threats is only just beginning. That brings players like Fortinet to the fore IT programmes and it's pensively to develop programs for enterprise makes it an interesting one going forward.
GLP-1 ‘Weight Loss’ Medicines Another theme of being a really strong driver of the S&P 500 is the rise of GLP-1 medicines. The weight loss craze that has come off the back of this Amazon has been incredible. Initially obviously developed for diabetes but having an additional effect of weight loss has created a product out of nowhere.
Eli Lilly and Co is a key player in this space with its GLP one class medicines already approved by the FDA. It's been launched in the US and its oral intake has posted adoption. It is not the only one in this space but shows very clearly the impact weight loss medicines are having on earnings.
The caveat we have though is side effects and long term impacts are still being found and could be said as a capping issue on price. Whatever way you look at it the US dating season however will be incredibly exciting and it is the reason The US markets continue to see huge capital inflows as they are much more exciting in this current environment than traditional value markets such as Australia.
The 8 April ceasefire announcement and parallel discussions around a 45-day truce have not resolved the Strait of Hormuz disruption. They have, for now, capped the worst-case scenario, but tanker traffic remains at a fraction of normal levels and Iran's demand for transit fees signals a structural shift, not a temporary one.
What began as a regional conflict has become a global energy shock, and the question for markets is no longer whether Hormuz was disrupted, but how permanently the disruption changes the pricing floor for oil.
Key takeaways
Around 20 million barrels per day (bpd) of oil and petroleum products normally pass through the Strait of Hormuz between Iran and Oman, equal to about one-fifth of global oil consumption and roughly 30% of global seaborne oil trade.
This is a flow shock, not an inventory problem. Oil markets depend on continuous throughput, not static storage.
If the disruption persists beyond a few weeks, Brent could shift from a short-term spike to a broader price shock, with stagflation risk.
Tanker traffic through the strait fell from around 135 ships per day to fewer than 15 at the peak of disruption, a reduction of approximately 85%, with more than 150 vessels anchored, diverted, or delayed.
A two-week ceasefire was announced on 8 April, with 45-day truce negotiations under way. Iran has separately signalled a demand for transit fees on vessels using the strait, which, if formalised, would represent a permanent geopolitical floor on energy costs.
Markets have begun rotating away from growth and technology exposure toward energy and defence names, reflecting a view that elevated oil is becoming a structural cost rather than a temporary risk premium.
Institutional Grade Performance
Master the Markets with MetaTrader 5
Trade hundreds of instruments with superior speed and advanced technical analysis. Harness full EA functionality to execute your strategy.
The Strait of Hormuz handles roughly 20 million barrels per day of oil and petroleum products, equal to about 20% of global oil consumption and around 30% of global seaborne oil trade. With global oil demand near 104 million bpd and spare capacity limited, the market was already tightly balanced before the latest escalation.
The strait is also a critical corridor for liquefied natural gas. Around 290 million cubic metres of LNG transited the route each day on average in 2024, representing roughly 20% of global LNG trade, with Asian markets the main destination.
The International Energy Agency (IEA) has described Hormuz as the world’s most important oil transit chokepoint, noting that even partial interruptions may trigger outsized price moves. Brent crude has moved above US$100 a barrel, reflecting both physical tightness and a rising geopolitical risk premium.
Source: US Energy Information Administration, dated June 17, 2025, using 2024 daily average
Tankers idle as flows slow
Shipping and insurance data now point to strain in real time. More than 85 large crude carriers are reported to be stranded in the Persian Gulf, while more than 150 vessels have been anchored, diverted or delayed as operators reassess safety and insurance cover. That would leave an estimated 120 million to 150 million barrels of crude sitting idle at sea.
Those volumes represent only six to seven days of normal Hormuz throughput, or a little more than one day of global oil consumption.
Updated shipping and insurance data now confirm more than 150 vessels have been anchored, diverted, or delayed, up from the 85 initially reported. The 1.3 days of global consumption coverage from idle crude remains the binding constraint: this is a flow shock, not a storage problem, and the ceasefire has not yet translated into meaningfully restored throughput.
🌋 Trump, volatility and Hormuz.
As tariff shocks collide with a ten year extreme in oil positioning, the margin for error is zero. See the technical markers and safe haven pivots defining the current risk environment.
Oil markets function on continuous movement. Refineries, petrochemical plants and global supply chains are calibrated to steady deliveries along predictable sea lanes. When flows through a chokepoint that carries roughly one-fifth of global oil consumption and around 30% of global seaborne oil trade are interrupted, the system can move from equilibrium to deficit within days.
Spare production capacity, largely concentrated within OPEC, is estimated at only 3 million to 5 million bpd. That falls well short of the volumes at risk if Hormuz flows are severely disrupted.
GO Markets — Idle Tankers: Days of Cover
Oil market analysis
How long do idle tankers last?
135M idle barrels — days of cover against each demand benchmark
vs. Strait of Hormuz daily flow (20M bbl/day)
6.75 daysof Hormuz throughput covered
6.75 days
0
5
10
15
20
25
30 days
vs. Global oil consumption (104M bbl/day)
1.3 daysof world demand covered
1.3 days
0
5
10
15
20
25
30 days
vs. US Strategic Petroleum Reserve release (1M bbl/day)
135 daysof full SPR release pace covered
135 days — but SPR exists to replace this role
0
5
10
15
20
25
30 days
135M
idle barrels on tankers (midpoint of 120–150M range)
~33%
of daily Hormuz flow that is idle storage, not transit
<31 hrs
is all idle storage against global daily consumption
Indicative market trajectories based on disruption severity
Scenarios for the weeks ahead
1–2 WEEKS
Ceasefire catch-up
Markets face catch-up repricing. Brent could consolidate in the US$105–US$115 range as risk premia unwind. Brent may trade lower (US$95–US$110) if strategic stocks bridge the temporary shortfall.
2–4 WEEKS
Infrastructure blitz
Shifts to structural supply shock. Brent moving toward US$150–US$200 cannot be ruled out. This is the stagflation trigger where energy costs constrain central bank flexibility.
STRUCTURAL
Geopolitical floor
Iran's transit fee demand creates a permanent input cost. The pre-crisis price structure (US$60–US$70) may not return, embedded in insurance and freight rates.
Critical Threshold
US$120 remains the level at which energy inflation becomes a direct Federal Reserve policy problem.
Inflation risks and macro spillovers
The inflationary impact of an oil shock typically arrives in waves. Higher fuel and energy prices may lift headline inflation quickly as petrol, diesel and power costs move higher.
Over time, higher energy costs may pass through freight, food, manufacturing and services. If the disruption persists, the combination of elevated inflation and slower growth could raise the risk of a stagflationary environment and leave central banks facing a difficult trade-off.
🛢️ Brent hits $100.
Exxon and SLB are leading the rotation out of tech. Get the price targets and technical support levels for the top 5 energy majors.
What makes the current episode particularly acute is the lack of slack in the global system.
Global supply and demand near 103 million to 104 million bpd leave little spare cushion when a chokepoint handling nearly 20 million bpd, or about one-fifth of global oil consumption, is compromised. Estimated spare capacity of 3 million to 5 million bpd, mostly within OPEC, would cover only a fraction of the volumes at risk.
Alternative routes, including pipelines that bypass Hormuz and rerouted shipping, can only partly offset lost flows, and usually at higher cost and with longer lead times.
Bottom line
Until transit through the Strait of Hormuz is restored and seen as credibly secure, global oil flows are likely to remain impaired and risk premia elevated. For investors, policymakers and corporate decision-makers, the core question is whether oil can move where it needs to go, every day, without interruption.
Market Opportunity
Don't just watch the squeeze. Trade the framework.
As positioning gaps hit decade extremes, access advanced charting tools and real time execution on the six key markets defining this cycle.
A headline about a civilisation "dying tonight" is built to overwhelm, but the more telling signal may be the calm underneath it, because markets are starting to treat this cycle of sharp escalation followed by sudden de-escalation as a pattern, not a surprise.
In macro circles, that pattern has a blunt label: TACO, or "Trump Always Chickens Out". The phrase is loaded, but the logic is simple. A maximum-pressure threat hits, risk assets wobble, then a pause, delay or softer outcome appears once the economic cost starts to bite.
That does not mean the risk is small. It may just mean investors have grown used to a script where rhetoric flares, markets absorb the shock, and restraint shows up before the worst-case scenario fully lands.
Developing situation
|
Strait of Hormuz | Section 122 Tariffs
PublishedApril 2026
Brent CrudeAbove US$100
VIX31
In focus6 markets
Oil PositioningDecade-low longs
The Framework & MechanismIs the market the red line?
+
This is where the TACO idea starts to matter. Traders are not just watching the rhetoric. They are watching when it starts to hit markets, inflation and the wider economy.
Oil is at the centre of that risk. If disruption around the Strait of Hormuz starts to threaten global energy flows, the story quickly becomes macro. Higher oil can lift inflation expectations, pressure central banks and tighten financial conditions.
That is why a pause can look less like diplomacy and more like pressure relief. The real red line may be the point where the economic damage becomes too obvious to ignore.
Short Squeezed
Positioning adds another layer. Oil still looks under-owned, with futures positioning near decade-long bearish extremes. If a fresh shock lands, short-covering could drive prices higher much faster than fundamentals alone would suggest.
That is the short-squeeze risk. In the Commitment of Traders (COT) report, recent data suggests oil long exposure is relatively low by historical standards.
Humanitarian Reality
Whatever may be promised in political messaging, any sustained conflict in Iran would carry a heavy cost in displacement, infrastructure damage and wider regional stress. A relief rally in markets does not change that.
Global Isolation
Even if pauses are used to steady domestic market sentiment, allies and multilateral institutions may view bluff-and-retreat tactics as a credibility problem that creates longer-term diplomatic friction.
Positioning gap indicator
Divergence analysis between positioning and risk environment
APRIL 2026
Bars show GO Markets’ internal estimate of the divergence between current futures positioning and levels seen in comparable historical shock environments.
Brent crudeExtreme
Gold (XAU/USD)Very high
Nasdaq 100High
USD/CNHHigh
US 10 yr yieldMedium
USD/CADMedium
Extreme decade scale positioning extreme
High significant divergence
Medium moderate divergence
Methodology note
The Positioning Gap Indicator is based on GO Markets’ internal analysis and is intended as a high-level, illustrative framework only. It uses a combination of market positioning data, historical comparisons and discretionary assumptions about how similar energy and trade shocks have affected markets in the past. The ‘Extreme’, ‘Very High’, ‘High’ and ‘Medium’ labels are relative internal classifications, not objective market standards, and should not be relied on as predictions, forecasts or a guarantee of future outcomes.
The Six Markets
The six markets that matter most
Each of these six markets is exposed to the current situation through a different mechanism. Understanding the mechanism, not just the price, matters. It helps explain whether a move is a headline reaction or the start of something broader. Tap any card to expand the full analysis.
01
BRENT
Brent crude oil
ENERGYDIRECT CHANNELSQUEEZE RISK: EXTREME
+
The Clear Transmission Channel
Brent is the international benchmark for crude and the most direct transmission mechanism in this geopolitical thesis. Any disruption to physical flows, particularly through the Strait of Hormuz, forces an immediate tightening of global energy supply.
The Positioning Backdrop
Futures positioning currently sits at a ten year bearish extreme. Leveraged funds have cut long exposure heavily. In the event of a physical supply shock, this imbalance creates the potential for a violent short covering squeeze.
● Bull Case
Hormuz disruption extends beyond four weeks. Extended disruption could lift Brent sharply if supply flows are impaired for longer.
● Bear Case
Diplomatic intervention reopens the strait quickly. Strategic petroleum reserve (SPR) releases and increased spare capacity cap any price rally.
Strategic Marker
US$120: the point at which energy inflation becomes a direct Federal Reserve policy problem, rather than just a market narrative.
02
XAU/USD
Gold
SAFE HAVENUNDER-OWNEDSQUEEZE RISK: VERY HIGH
+
The Counter-Intuitive Setup
Despite a clear geopolitical risk profile, leveraged funds have been reducing bullish gold exposure. This leaves the market under-owned at the exact moment the fundamental case for safe haven assets is strengthening.
The Inflation Variable
The critical factor for Gold is whether energy-driven inflation limits the Fed's room to maneuver. If policy flexibility weakens, Gold could catch up quickly as a hedge against stagflation.
● Bull Case
Real yields fall as energy inflation outpaces rate hikes. Under-owned positioning amplifies the catch up move as institutional funds rebuild exposure.
● Bear Case
Geopolitical tensions ease rapidly. The Fed remains credibly focused on inflation, keeping real yields positive and supporting the USD over Gold.
Strategic Marker
One level to monitor is prior resistance, alongside any change in COT positioning.
03
US100/NAS100
Nasdaq 100
TECHNOLOGYDUAL PRESSURERATE AND SUPPLY RISK
+
Why it is a complicated position
The Nasdaq faces immediate pressure from two fronts: Stickier energy-driven inflation forces rates higher for longer, compressing multiples, while trade tensions unsettle the supply chains beneath major tech names.
Why the 10 year yield matters here
When the 10 year Treasury yield holds above 4.5%, the future value of technology earnings must be discounted at a higher rate. AI linked earnings momentum must overpower this valuation headwind.
● Bull Case
Earnings season delivers proof of AI investment generating real revenue. Index components successfully insulate supply chains, and AI capex momentum overrides the macro headwind.
● Bear Case
Energy inflation keeps yields above 4.5%. Multiple compression in high valuation names triggers a broader index decline amid disappointments in AI monetization.
Strategic Marker
S&P 500 at 6,498: a widely watched Fibonacci cluster. A sustained move below this threshold highlights a historically challenging framework for growth equities.
04
USD/CNH
US dollar/offshore Chinese yuan
FXBEIJING READPOLICY PROXY
+
What it tells you
USD/CNH is the cleanest real time read on how Beijing is responding to tariff pressure. A sharp rise suggests China is allowing currency weakness to absorb the costs of trade friction.
Why it matters beyond China
A move in USD/CNH doesn't stay contained. It spills into Asian equities, commodity demand, and broader risk appetite. Deliberate depreciation signals a shift in the global trade environment.
● USD Bull / Yuan Bear
Beijing allows yuan weakness as a deliberate countermeasure. Capital outflows accelerate, and USD safe haven demand reinforces the move.
● Yuan Recovery
Trade negotiations begin and a face saving off ramp is found. PBOC intervention defends the yuan, and the dollar's safe haven premium fades.
Strategic Marker
7.30 on USD/CNH: a sustained move above this has historically been associated with broader risk off moves in Asian markets.
05
US10Y/TNOTE
US 10 year Treasury yield
RATESMACRO PLUMBINGSHAPES EVERYTHING ELSE
+
Why it sits under everything
The 10 year yield shapes mortgage costs, corporate borrowing, and the valuation framework for risk assets globally. When it rises, borrowing becomes more expensive across the entire system.
The Independent Movement Risk
If oil forces the Fed to delay cuts, the 10 year yield could rise regardless of Fed communication. It can tighten financial conditions even before a formal policy shift occurs.
● Rates Fall Case
Oil shock proves transient. Fed maintains guidance and 10 year yields pull back toward 4.0%, relieving pressure on equities and providing support for bonds.
● Rates Rise Case
Sustained oil above US$100 pushes inflation higher. Fed pauses rate cut language and the 10 year yield breaks above 4.5%, compressing equity multiples.
Strategic Marker
4.5% on the 10 year yield: a sustained break above this while oil remains above US$100 is a historically challenging combination for equities.
06
USD/CAD
US dollar/offshore Canadian dollar
FXOIL-LINKEDLEAD INDICATOR
+
The Double Exposure
USD/CAD is a lead indicator because Canada sits at the intersection of energy and trade. It benefits from higher oil revenue but is highly sensitive to US economic and trade conditions.
When the Forces Collide
When oil rises, the CAD often strengthens; when trade stress rises, it weakens. In the current environment, these forces are colliding rather than canceling each other out.
● CAD Strengthens
Oil sustained above US$100 boosts export revenue while trade tensions stay short of Canada specific tariffs. Bank of Canada holds rates steady.
● CAD Weakens
Safe haven USD demand outweighs the oil benefit. Bank of Canada cuts rates to offset trade headwinds.
Strategic Marker
1.42 on USD/CAD: a sustained move above this signals trade anxiety is dominating the oil benefit, often preceding broader risk off moves.
What could go wrong
Four reasons the market logic could fail
+
A coherent macro case is still only a case. Markets regularly ignore tidy narratives for longer than expected, or invalidate them quickly. Four failure paths stand out.
1
The situation de-escalates faster than the news cycle suggests
Geopolitical risk premia can build slowly and disappear quickly. Any credible sign of de-escalation, especially around shipping lanes or energy infrastructure, could reverse oil sharply and drain urgency from the rest of the thesis. This is precisely the scenario the TACO framework predicts.
2
Tariff posturing does not become tariff policy
The market may be reacting to opening positions rather than settled policy. If Washington and Beijing find a face-saving off-ramp, as they have in previous trade disputes, currency and equity moves that anticipated escalation could unwind just as fast as they built.
3
AI investment spending overrides the macro headwind
Technology capital expenditure has remained more resilient than expected for much of the past two years. If earnings season shows that AI infrastructure spending is still translating into real demand and returns, the growth narrative may reassert itself, particularly in the Nasdaq 100.
4
The squeeze never arrives: extended positioning holds for longer than expected
Stretched positioning does not automatically produce a violent reprice. Markets can stay under-owned for months if risk appetite remains weak and institutions are unwilling to rebuild exposure. The set-up can exist without the catalyst arriving in a way that forces the move.
Forward Calendar
What to watch and when
+
Three time horizons matter here. The first tests supply resilience. The second tests financial system health. The third tests whether any shift in market leadership is cyclical or structural.
Three horizon watchlist
Signals and catalysts across the next two months
Next Two Weeks
Chipmaker guidance and supply commentary
Major semiconductor earnings calls will offer an early read on whether supply bottlenecks are worsening and whether management teams are changing production assumptions. If supply commentary deteriorates, the inflation story gets another push and the case for higher for longer rates strengthens.
Next 30 Days
Bank earnings and loan demand
Major US banks will provide a useful check on whether capital spending related to AI infrastructure is still being financed. The most important signal may not be earnings per share. It may be commercial loan demand. If businesses are pulling back on borrowing, the growth cycle may be softening earlier than the market expects.
Next 60 Days
Enablers versus spenders
The more structural test is whether the market begins rewarding businesses that produce physical outputs: energy producers, hardware makers and defence contractors, while penalising software companies that still cannot prove a clear return on AI spending. A wider performance gap between those groups would suggest something deeper than a temporary rotation.
The path ahead
The current convergence of geopolitical tension and historical positioning extremes has created a unique "coiled spring" environment for global markets. While the TACO framework suggests a pattern of sharp escalation followed by strategic pauses, the real test for traders over the next 60 days will be the transition from headline-driven volatility to structural market rotation.
Whether the positioning gap closes through a gentle de-escalation or a violent short squeeze, having a defined reaction framework can help traders navigate the noise.
Market Opportunity
Don't just watch the squeeze. Trade the framework.
As positioning gaps hit decade extremes, access advanced charting tools and real time execution on the six key markets defining this cycle.
So here is the thing: April’s US earnings season is arriving in a market that still feels anything but normal. As GO Markets explains in The global US earnings playbook: The essential guide for traders, this reporting period is landing after a real shift in what markets care about. It is no longer just about chasing growth at any cost. It is about what the numbers are saying beneath the surface.
And in 2026, those signals are colliding with a high-friction backdrop:
Geopolitical conflict: Ongoing tension in the Middle East
Oil supply shock: Brent crude above US$100
The Fed: A central bank still boxed in by sticky inflation
The durability pivot
Yes, AI is still the market’s main story but it's still the flashy engine getting most of the attention. But underneath that, there is a quieter move towards companies that look built to hold up better when conditions get harder.
When rates are uncertain and energy markets are under pressure, names like JPMorgan Chase and the major defence contractors start to carry more weight. They are not replacing the AI narrative, rather, they are becoming part of the way traders read risk appetite, earnings durability and, ultimately, where the market is looking for something more solid to hold on to.
!
Important: Reporting schedules can change without notice. Reporting dates and release times are from company investor relations calendars where marked Confirmed; otherwise they are GO Markets estimates. Consensus EPS, revenue and analyst-range data are from third-party market consensus sources, as of 7 April 2026 (AEDT). Company guidance, backlog and operating metrics are from the latest company filings or results presentations unless stated otherwise. Figures and schedules may change without notice.
$JPM| Q1 2026 REPORTING PERIOD
JPMorgan Chase & Co.
NYSE | Financial Services | 14 Apr 2026
Confirmed
Global Release Countdown (BMO)
00:00:00:00
Consensus EPS
US$5.42
Consensus Revenue
US$47.88bn
AU/ASIA14 Apr | 8:45 pm
US/LATAM14 Apr | 6:45 am
Market Intelligence: $JPM
Analysis: JPM price drivers and scenarios
NII guidance
~US$103 billion
Full year | US$95 billionn ex:markets
ROTCE target
17%
Possible return on tangible common equity
Analyst range
US$5.02-5.70
Low to high estimate spread
AVG
LOW US$5.02AVG US$5.39HIGH US$5.70
The analyst spread of US$0.68 signals genuine disagreement about how the rate environment is flowing through to margins. A result above consensus but below the high end estimate may produce a muted reaction. A result above US$5.70 may shift the discussion.
Key swing factors for the result
Net interest income (NII)
The clearest macro lever. It reflects the gap between lending rates and deposit costs.
Guidance: US$103 billion for the full year
Return on tangible common equity (ROTCE)
A scale check. It indicates whether JPM is converting scale into efficiency. 17% is the benchmark.
Target: 17% ROTCE
Trading and investment banking
Strong Q1 growth was expected in fees and markets revenue. These lines can offset softness in lending, and stronger-than-expected performance here may shift the narrative away from rate sensitivity.
Watch: investment banking (IB) fees versus the prior quarter
Expense discipline
A bank can beat the EPS estimate and still sell off if expense growth is running too hot. Pairing the EPS result with the expense trajectory gives a fuller read on whether the beat is durable.
Watch: Expense outlook commentary
Trade Execution: $JPM
Earnings reaction framework: Q1 2026
Bull case
EPS above US$5.70, NII on track | ROTCE at or above 17%
The result comes in above the top of the analyst range. NII guidance holds or is revised higher. IB fees and markets revenue show strong Q1 growth. Expense commentary is constructive.
Possible reaction: momentum and repositioning
Base case
EPS between US$5.39 and US$5.70, NII in line | ROTCE near target
The result beats consensus but stays within the expected range. NII tracks guidance. The tone of the conference call may matter more than the headline number. The first move may fade if guidance is unchanged.
Possible reaction: muted or mixed initial response
Bear case
EPS below US$5.39 | NII misses | Expense growth surprises
The result comes in at or below the consensus midpoint. NII guidance is cut or qualified. Expense growth comes in above market expectations. IB or markets revenue disappoints.
Possible reaction: earnings multiple repricing
Reaction trigger to watch: The market response in the first 30 minutes after the result may indicate which scenario traders are leaning towards. A move above the prior session high on volume may support the bull case. A fade back into the range after an initial pop may point to the base case. A break below the prior session low on volume may suggest the bear case is gaining traction.
Sentiment Analysis · JPMorgan Chase
Interactive scenario analysis: $JPM
Select earnings outcome
Growth momentum
AI-linked offset, beat supported by NII and ROTCE
Stronger-than-expected demand for AI-related industrial lending may offset softer mortgage activity. Management maintains guidance as NII remains resilient in higher-for-longer conditions. IB fees and markets revenue may provide additional support. ROTCE at or above 17% would suggest the bank is converting scale into earnings efficiently.
EPS Outcome
Above US$5.70
NII Signal
On track
ROTCE
At or above 17%
Likely Reaction
Momentum may build
Sources & Data Methodology
Sources: Reporting dates and release times are from company investor relations calendars where marked Confirmed; otherwise they are GO Markets estimates. Consensus EPS, revenue and analyst-range data are sourced from Bloomberg and Earnings Whispers, as at 7 April 2026 (AEDT). Company guidance, backlog and operating metrics are sourced from the latest company filings, results presentations or investor relations materials unless stated otherwise. Any scenario analysis reflects GO Markets analysis. Figures and schedules may change without notice.
From credit to defence
If JPMorgan gives the market an early read on the consumer, credit quality and business activity, the defence names may be telling a different story. This is the point where the focus may start to shift from the credit cycle to government-backed demand.
In a market still shaped by geopolitical risk, that matters. Long-dated programs can help support revenue visibility, even when the broader outlook looks less certain. That is one reason the sector remains on the watchlist.
$LMT| Q1 2026 REPORTING PERIOD
Lockheed Martin Corp.
NYSE | Aerospace | Defense | 22 Apr 2026
Estimated
Global Release Countdown (BMO)
00:00:00:00
Consensus EPS
US$6.50
Consensus Revenue
US$16.32bn
AU | ASIA22 Apr | 9:20 pm
US | LATAM22 Apr | 7:20 am
Market Intelligence: $LMT
Analysis: LMT price drivers and scenarios
Order backlog
US$194 billionn
Record visibility
Book-to-bill
1.2x
Orders outpacing sales
Analyst range
US$6.90-7.10
Low to high estimate spread
AVG
LOW ~US$6.90AVG ~US$6.94HIGH US$7.10+
The consensus sits near the lower end of the analyst range. That positioning may leave room for upside if backlog growth and F-35 delivery timelines support execution. A print near the high end, above US$7.10, may extend the move, although the reaction would still depend on guidance and margins.
Key swing factors for the result
Backlog visibility
Primary evidence of demand. Book-to-bill above 1.2x would support full-year guidance and the production ramp.
Backlog: US$194 billion record
Free cash flow (FCF)
Defence stocks are often assessed on cash conversion. The market may look for confirmation of the US$6.5 billion floor.
Guide: US$6.5 billion - $6.8 billion
Missile segment growth
PrSM and THAAD deliveries remain key watchpoints. Strong space margins may help offset softness in aeronautics.
Watch: Fire Control margins
Margin pressure
Pension charges and production inflation remain risks. An earnings beat may fade if operating margins contract.
The result clears the upper half of the analyst range. Management reaffirms or raises the full-year FCF outlook. Strong Missiles and Fire Control (MFC) margins help offset any aeronautics supply chain lag.
Possible reaction: momentum may build and positioning may improve
Base case
EPS between US$6.30 and US$6.70 | Backlog steady at about US$194 billion
The result aligns with the US$6.38 consensus. F-35 delivery pace remains on track but offers no meaningful upside surprise. The market may wait for more specific segment guidance on the conference call.
Possible reaction: muted or mixed initial response
The result falls towards the bottom of the analyst spread. Management cites further software delays or program losses. The FCF trajectory narrows towards the lower end of previous expectations.
Possible reaction: the share price may come under pressure
Reaction trigger to watch: The market response in the first 30 minutes after the result may indicate which scenario traders are leaning towards. A move above the prior session high on volume may support the bull case. A fade back into the range after an initial pop may point to the base case. A break below the prior session low on volume may suggest the bear case is gaining traction.
Sentiment Analysis · Lockheed Martin
Interactive scenario analysis: $LMT
Select earnings outcome
Backlog confirmed
Backlog and FCF confirmation may support continuation
EPS clears the top of the analyst range. Backlog holds at or above US$194 billion and book-to-bill stays above 1.2, which would suggest orders are replenishing faster than revenue is being recognised. FCF guidance holds within the stated range.
EPS outcome
Above US$7.00
Backlog signal
Above US$194 billion
FCF guide
Holds or improves
Likely reaction
Continuation may follow
Sources & Data Methodology
Sources: Reporting dates and release times are from company investor relations calendars where marked Confirmed; otherwise they are GO Markets estimates. Consensus EPS, revenue and analyst-range data are sourced from Bloomberg and Earnings Whispers, as at 7 April 2026 (AEDT). Company guidance, backlog and operating metrics are sourced from the latest company filings, results presentations or investor relations materials unless stated otherwise. Any scenario analysis reflects GO Markets analysis. Figures and schedules may change without notice.
Not all defence names are the same
Lockheed Martin and Northrop Grumman may sit in the same defence bucket, but the market does not always read them the same way. Lockheed is more closely tied to the F-35 and current air combat demand. Northrop is more closely linked to next-generation programs such as the B-21 Raider and Sentinel.
That gives this section its contrast. One is often read through the lens of current defence demand. The other is more closely tied to longer-cycle strategic modernisation.
$NOC| Q1 2026 REPORTING PERIOD
Northrop Grumman Corp.
NYSE | Defense | Space Systems | 23 Apr 2026
Estimated
Global Release Countdown (BMO)
00:00:00:00
Consensus EPS
US$6.12
Consensus Revenue
US$10.24 billion
AU | ASIA23 Apr | 10:30 pm
US | LATAM23 Apr | 8:30 am
Market Intelligence: $NOC
Analysis: NOC price drivers and scenarios
Consensus EPS
US$6.96
Quarterly analyst average
Order Backlog
US$95.7 billion
Record revenue visibility
FY 2026 EPS guide
US$27.40-US$27.90
Full-year 2026 outlook
AVG
LOW ~US$6.90AVG ~US$6.96HIGH US$7.20+
The consensus sits near the lower end of the analyst range. That offers a quick visual for whether the result is merely in line or strong enough to ease the guidance concerns that weighed on the stock after its last update. A result above US$7.20 may shift the conversation more materially.
Key swing factors for the result
Book-to-bill ratio
Currently at 1.10, suggesting orders are still running ahead of revenue recognition. This remains an important signal for multi-year growth visibility in defence.
Watch: 1.10 target
Guidance reset risk
Management’s guidance previously came in below market expectations. The market may be sensitive to any further softening in the 2026 outlook.
Watch: guidance commentary
Program concentration
The B-21 Raider and Sentinel carry outsized execution sensitivity. Updates on production ramp and funding may be the clearest drivers of sentiment for the stock.
Watch: B-21 and Sentinel updates
Capacity investment
Higher capital expenditure (capex) supports the industrial base over the longer term, but it may pressure near-term margins. Watch for signs that current investment is weighing on earnings power.
The result comes in above the cited threshold. Management says B-21 Raider production is ahead of schedule, with improving margins. Sentinel program restructuring costs remain below baseline expectations. International awards lift the book-to-bill ratio above 1.15.
Possible reaction: momentum may improve
Base case
EPS between US$6.00 and US$6.20, backlog steady at about US$95.7 billion
The result is broadly in line with the cited range. FCF targets for 2026 are reaffirmed but not expanded. Market focus shifts to organic sales growth metrics and segment operating margins. The initial reaction may depend on the timing of B-21 milestone payments.
The result lands near the low end of the analyst spread. Management flags higher infrastructure costs for Sentinel or delays in restricted space segment awards. Margin pressure in Aeronautics persists, and the 2026 revenue guide narrows towards the US$43.5 billion floor.
Possible reaction: shares may weaken
Reaction trigger to watch: The market response in the first 30 minutes after the result may indicate which scenario traders are leaning towards. A move above the prior session high on volume may support the bull case. A fade back into the range after an initial pop may point to the base case. A break below the prior session low on volume may suggest the bear case is gaining traction.
Sentiment Analysis · Northrop Grumman
Interactive scenario analysis: $NOC
Select earnings outcome
Stealth momentum
B-21 momentum, stronger execution and FCF support
EPS clears US$6.15. Management confirms a production capacity agreement for the B-21 Raider. Sentinel restructuring reaches Milestone B on schedule. Record backlog visibility and higher FCF guidance towards US$3.5 billion may support broader repositioning.
EPS outcome
Above US$6.15
B-21 Signal
Acceleration
FCF guide
$3.5 billionn range
Likely reaction
Momentum rally
Sources & Data Methodology
Sources: Reporting dates and release times are from company investor relations calendars where marked Confirmed; otherwise they are GO Markets estimates. Consensus EPS, revenue and analyst-range data are sourced from Bloomberg and Earnings Whispers, as at 7 April 2026 (AEDT). Company guidance, backlog and operating metrics are sourced from the latest company filings, results presentations or investor relations materials unless stated otherwise. Any scenario analysis reflects GO Markets analysis. Figures and schedules may change without notice.
Bottom line
In a market shaped by geopolitical risk and shifting rate expectations, companies with visible demand and longer-cycle revenue may continue to attract attention. But sentiment can still turn quickly if valuations are stretched, rate expectations shift again, or tensions in the Middle East ease.
That is why the story still needs to be tested against the numbers, not just the narrative. GO Markets will be analysing more companies throughout this earnings season. For more updates, visit our
earnings page,
follow our social media channels, or check the weekly newsletters.
Your next earnings setup starts here
Stay ahead of major beats, misses, and market surprises. Log in to your terminal, open a new account, or explore our dedicated earnings academy.