Keputusan Fed, imbal hasil Treasury, pelemahan USD, dan data regional dalam fokus | Prospek FX
Mike Smith
28/1/2026
•
0 min read
Share this post
Copy URL
Pasar FX memasuki jendela penting dengan keputusan kebijakan Federal Reserve dan konferensi pers, data aktivitas ISM AS, rilis inflasi Jerman, PMI China, dan angka tenaga kerja Australia semuanya jatuh tempo.
Fakta singkat
Yang akan datang Keputusan kebijakan Fed dan konferensi pers diawasi ketat untuk panduan tentang potensi waktu penurunan suku bunga, dengan implikasi untuk imbal hasil Treasury AS dan arah USD.
Luas Penjualan USD meningkat selama 48 jam terakhir. Langkah ini bertepatan dengan retorika tarif yang diperbarui dan sensitivitas yang meningkat terhadap narasi intervensi FX.
PMI Manufaktur ISM Dijadwalkan untuk Senin, 2 Februari, dengan ISM Services PMI pada Rabu, 4 Februari, memberikan wawasan tepat waktu tentang momentum pertumbuhan AS.
CPI Jerman, PDB dan pengangguran kawasan euro, PMI China, dan data tenaga kerja Australia memberikan konteks regional, terutama untuk persilangan EUR dan AUD.
USD/JPY
Apa yang harus ditonton
Keputusan Federal Reserve dan konferensi pers berikutnya adalah peristiwa penting yang mempengaruhi imbal hasil Treasury AS.
Setiap perubahan nada seputar kemajuan inflasi, risiko ekonomi, atau ekspektasi waktu penurunan suku bunga dapat mempengaruhi perbedaan hasil dan sensitivitas USD jangka pendek.
Kelemahan USD yang luas baru-baru ini, diperkuat oleh berita utama terkait tarif dan sensitivitas intervensi, telah menambah tekanan penurunan pada USD.
Di sisi JPY, sinyal inflasi Jepang, termasuk CPI Tokyo, relevan sebagai indikator tren harga domestik dan arah kebijakan potensial.
Rilis dan acara utama
Kamis 30 Jan: Jepang Tokyo CPI (Januari)
Kamis 30 Jan: Keputusan kebijakan Federal Reserve dan konferensi pers
Sen 2 Feb: PMI Manufaktur ISM AS
Rab 4 Feb: PMI Layanan ISM AS
Cuplikan teknis
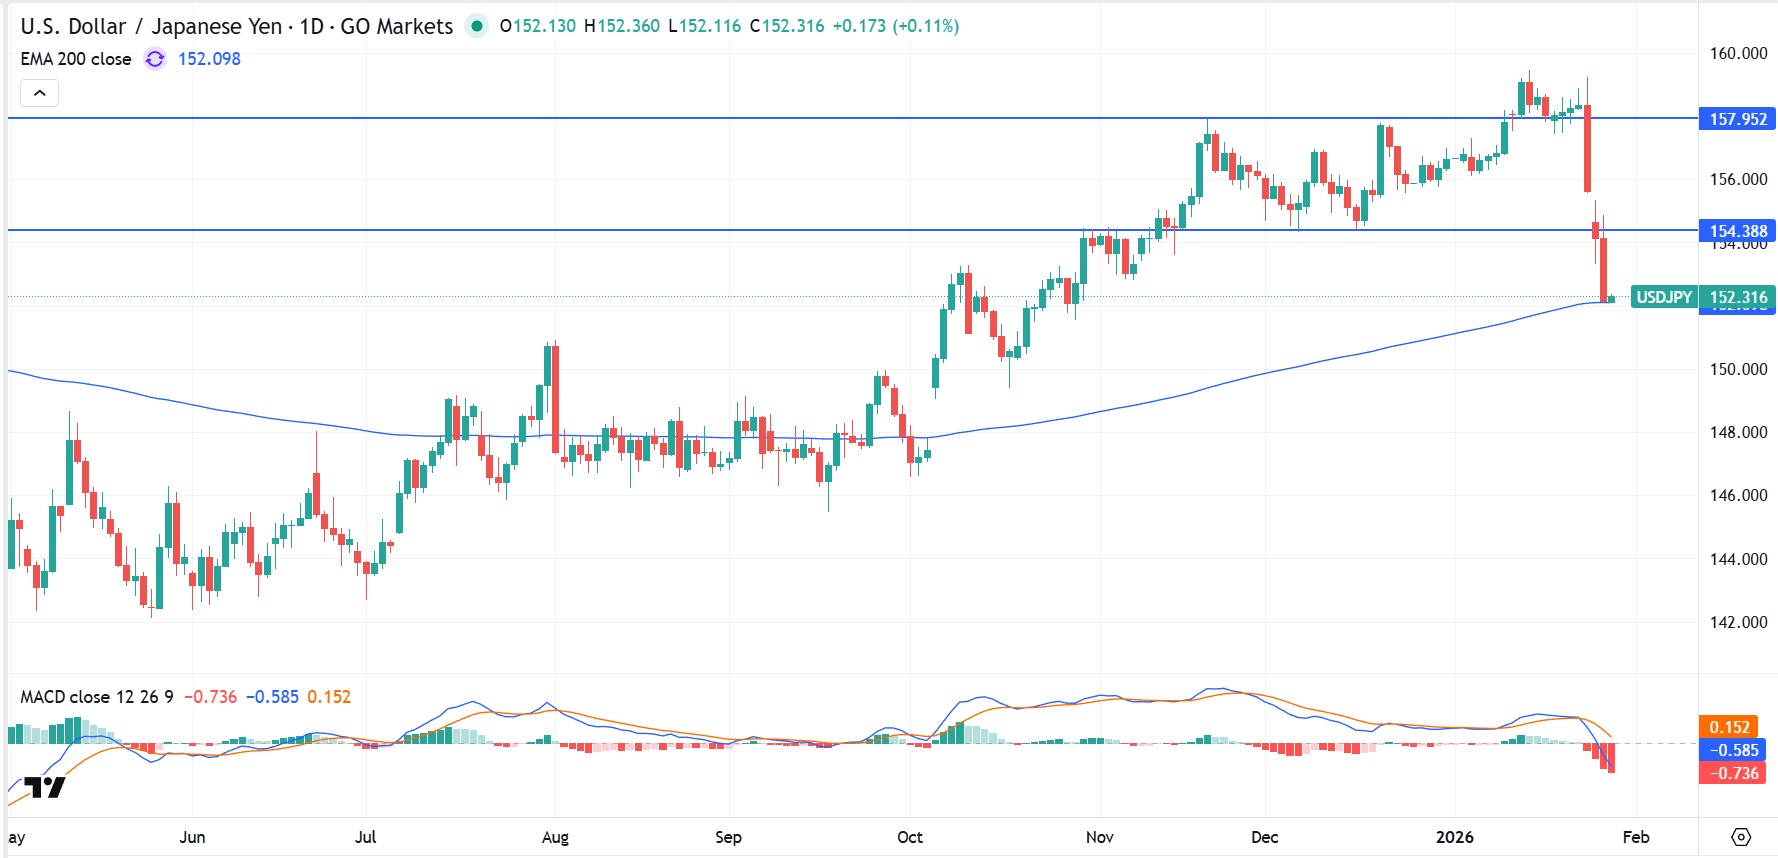
USDJPY telah menembus lebih rendah dari zona konsolidasi baru-baru ini, dengan kisaran penurunan terbukti selama 48 jam terakhir. Harga telah bergerak turun ke rata-rata pergerakan 200 eksponensial (EMA) dan sedang menguji level yang tidak terlihat sejak Oktober 2025.
Grafik 1 hari USDJPY
EUR/USD
Apa yang harus ditonton
Keputusan Fed dan konferensi pers dapat mempengaruhi EUR/USD terutama melalui pergerakan USD terkait dengan reaksi imbal hasil Treasury.
Di sisi EUR, IHK Jerman akan menunjukkan tren inflasi, sementara PDB flash kawasan euro dan data pengangguran menginformasikan prospek pertumbuhan regional.
Rilis dan acara utama
Kamis 29 Jan: CPI Jerman (pendahuluan)
Kamis 29 Jan: PDB kilat zona euro, Q4 2025
Kamis 30 Jan: Keputusan Federal Reserve dan konferensi pers
Jum 30 Jan: Tingkat pengangguran zona euro
Cuplikan teknis
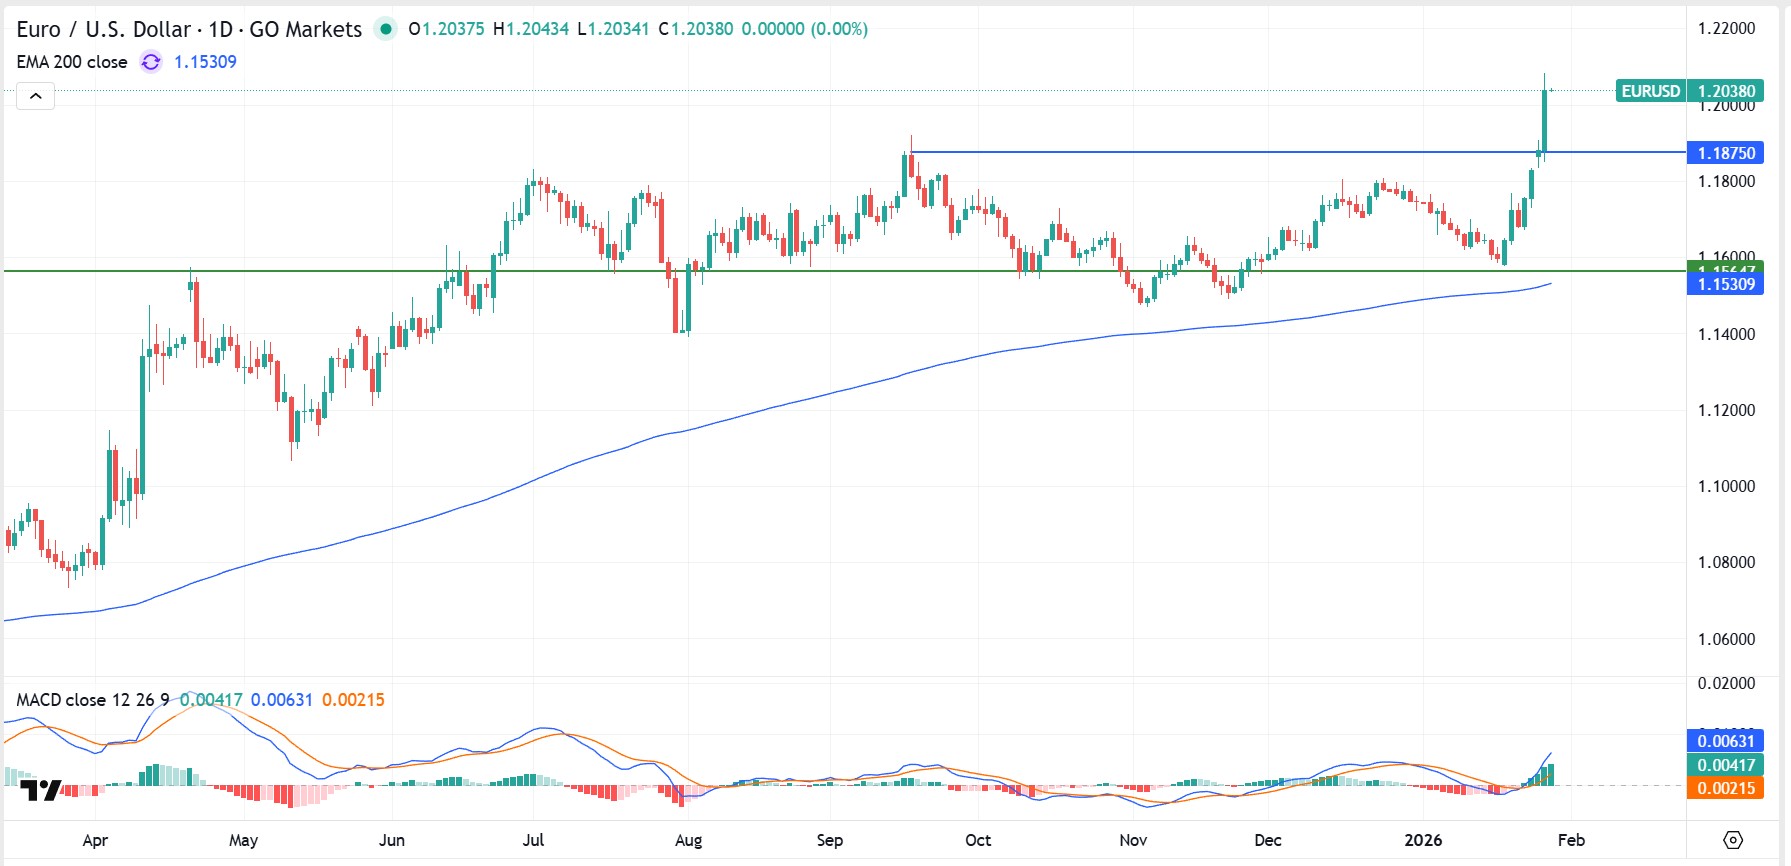
EURUSD telah meluas di atas level resistance sebelumnya, dengan rentang harian yang diperluas dan momentum yang kuat. Aksi harga di persimpangan USD lainnya menunjukkan pergerakan tersebut mungkin mencerminkan kelemahan USD, bukan pergeseran material dalam fundamental kawasan euro.
Grafik 1 hari EURUSD
EUR/AUD
Apa yang harus ditonton
Bersamaan dengan angka pertumbuhan kawasan euro, data ketenagakerjaan Australia dapat mempengaruhi sensitivitas EUR/AUD jangka pendek menjelang keputusan kebijakan RBA minggu depan.
PMI resmi China tetap relevan, karena perubahan ekspektasi aktivitas China dapat mempengaruhi AUD melalui permintaan komoditas dan sentimen risiko regional.
Rilis dan acara utama
Kamis 29 Jan: Angkatan Kerja Australia, Dirinci (Desember 2025), 11:30 pagi AEDT
Jum 31 Jan: PMI Manufaktur dan Non-Manufaktur resmi China
Sel 4 Feb: Keputusan kebijakan RBA
Cuplikan teknis
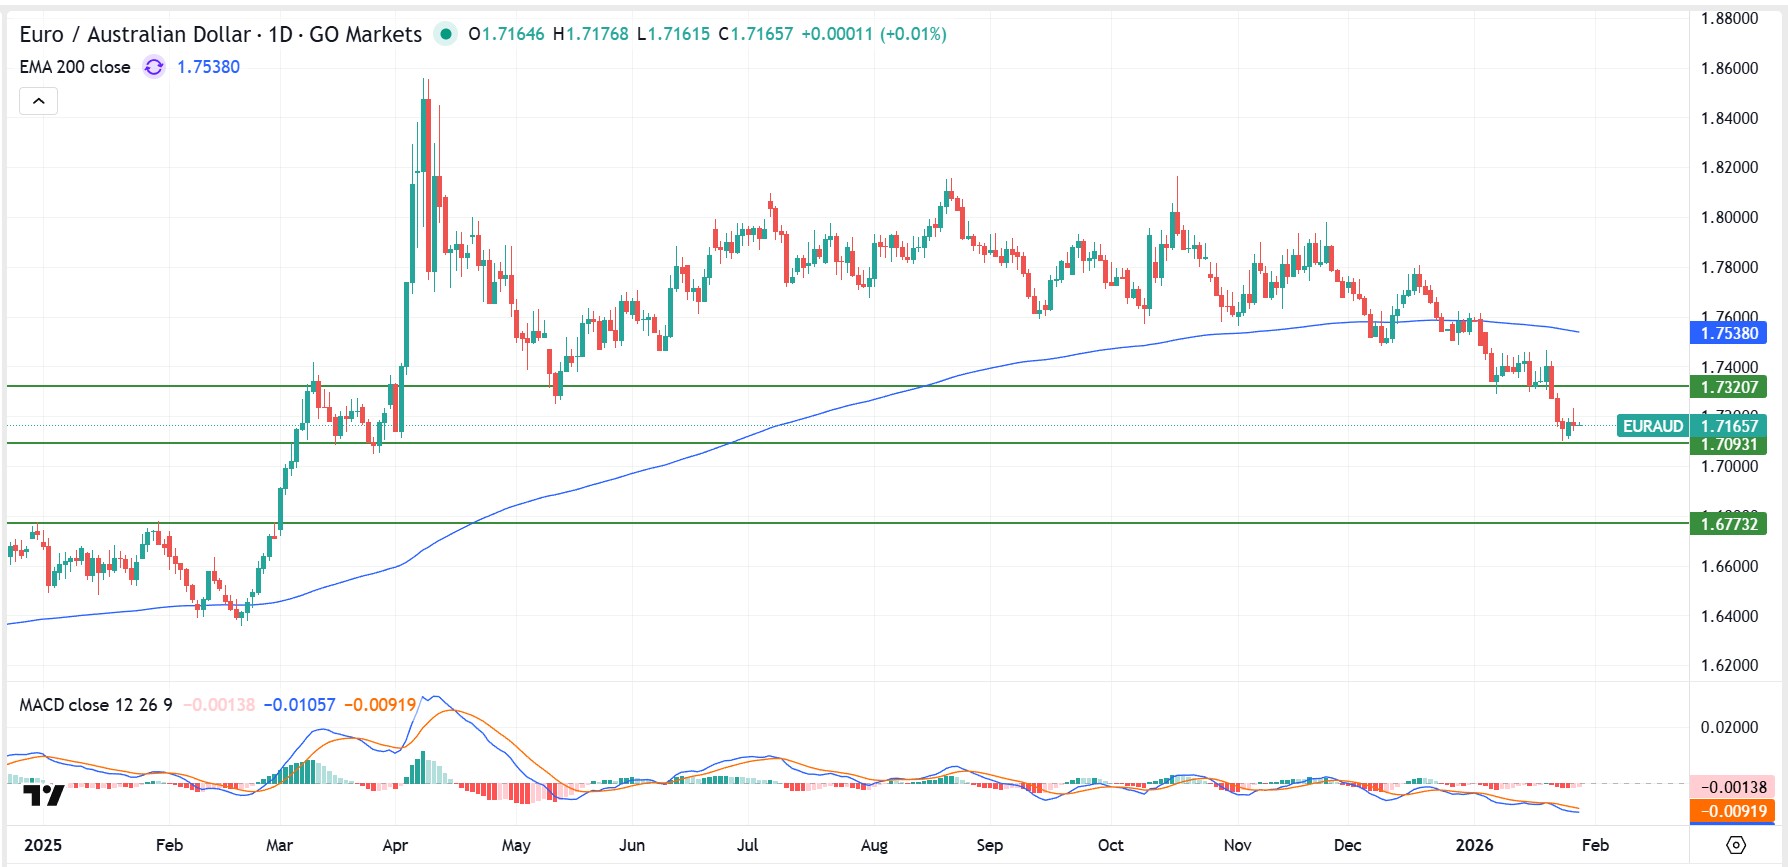
EUR/AUD telah secara tegas menembus di bawah zona support sebelumnya, dengan tingkat pengujian harga yang sekarang tidak terlihat sejak April 2025. Momentum tetap negatif, konsisten dengan fase penurunan baru daripada konsolidasi.
Grafik 1 hari EURAUD
Intinya
Keputusan Fed dan konferensi pers, data PMI AS, rilis inflasi Jerman, PMI China, dan angka tenaga kerja Australia dikelompokkan dalam jendela pendek.
Pasar akan mengawasi apakah kelemahan USD terbukti selama 48 jam terakhir meluas lebih jauh.
By
Mike Smith
Mike Smith (MSc, PGdipEd)
Client Education and Training
The information provided is of general nature only and does not take into account your personal objectives, financial situations or needs. Before acting on any information provided, you should consider whether the information is suitable for you and your personal circumstances and if necessary, seek appropriate professional advice. All opinions, conclusions, forecasts or recommendations are reasonably held at the time of compilation but are subject to change without notice. Past performance is not an indication of future performance. Go Markets Pty Ltd, ABN 85 081 864 039, AFSL 254963 is a CFD issuer, and trading carries significant risks and is not suitable for everyone. You do not own or have any interest in the rights to the underlying assets. You should consider the appropriateness by reviewing our TMD, FSG, PDS and other CFD legal documents to ensure you understand the risks before you invest in CFDs.
Mulailah dengan apa yang sebenarnya terjadi pada pasar FX menjelang April: ada guncangan geopolitik dan pasokan minyak dari Timur Tengah berada di bawah tekanan. Reaksi langsung di seluruh pasar mata uang adalah yang telah dilihat pedagang sebelumnya: uang bergerak menuju keamanan, menuju imbal hasil, dan menjauh dari apa pun yang tampak terpapar gangguan.
Arus safe-haven memenuhi divergensi hasil
Dolar AS mendapat manfaat dari kedua kekuatan itu sekaligus. Ini adalah tempat yang aman dan juga membawa keuntungan hasil yang tidak dapat ditandingi oleh sebagian besar rekan-rekannya saat ini. Franc Swiss mengambil beberapa luapan dari penghindaran risiko Eropa. Yen, yang dulunya menarik arus safe-haven hampir secara otomatis, terjebak dalam situasi yang berbeda sama sekali di mana kesenjangan hasil terhadap dolar sekarang begitu luas sehingga logika safe-haven telah digantikan oleh logika carry.
Mata uang yang mengalami bulan terberat adalah yang terjebak di tengah: sensitif terhadap risiko, terkait komoditas, atau menjalankan suku bunga kebijakan yang tidak dapat bersaing. Dolar Selandia Baru adalah contoh paling jelas sementara dolar Australia adalah cerita yang lebih berantakan. Di bawah semua itu adalah penetapan harga ulang ekspektasi penurunan suku bunga 2026 yang sekarang dinilai kembali oleh bank sentral di beberapa negara.
DXY context
Regained 100 on geopolitical risk
Strongest currency
USD — safe haven plus yield
Weakest currency
NZD — yield gap plus energy
Main central bank theme
Repricing of 2026 rate cut paths
Main catalyst ahead
Fed and BOJ policy meetings
Monthly leaderboard — biggest movers
01USD
Rose sharply on safe-haven demand and higher for longer yield expectations.
Strong
02CHF
Advanced strongly as the preferred European refuge from Middle East risk.
Up
03JPY
Highly volatile; fell to 20-month lows before intervention commentary.
Volatile
04AUD
Mixed; caught between domestic energy inflation and a hawkish RBA.
Mixed
05NZD
Fell sharply; pressured by energy exposure and capital outflows.
Weak
Penggerak terkuat: Dolar AS (USD)
Dolar AS menghabiskan sebagian besar tahun 2025 secara bertahap kehilangan tanah karena Fed memangkas suku bunga dan seluruh dunia mengejar ketinggalan. Cerita itu terhenti dengan keras pada akhir Maret. Konflik Iran mengubah kalkulus, dan dolar menegaskan kembali dirinya dengan cara yang mencerminkan sesuatu yang nyata tentang posisi strukturalnya di pasar global.
AS mengekspor minyak dan ketika harga energi naik, itu adalah perbaikan syarat perdagangan, bukan kejutan istilah perdagangan. Sebagian besar mata uang utama dolar berada di sisi lain dari persamaan itu. Tambahkan kisaran suku bunga kebijakan 3,50% hingga 3,75% yang sekarang terlihat terkunci lebih lama, dan keuntungan dolar bersifat siklus dan struktural pada saat yang bersamaan. Indeks Dolar AS (DXY) telah kembali ke level 100 tetapi Pertanyaan menuju April adalah apakah itu bertahan di sana atau mendorong lebih jauh.
Key drivers
Safe-haven demand:
The Iran conflict directed flows into US assets across equities, Treasuries, and the dollar itself.
Yield advantage:
The federal funds rate at 3.50% to 3.75% provides a meaningful return floor relative to most peers, helping to sustain capital inflows.
Energy insulation:
The US position as an oil exporter creates a structural terms-of-trade benefit when oil prices rise sharply.
Rate cut repricing:
Market expectations for 2026 Fed cuts have been scaled back significantly, removing a key source of dollar headwinds.
What markets are watching next
The DXY's ability to hold above 100 is the near-term reference point. The 10 April CPI print is the most direct test. A reading above expectations may add further support, while a soft print could give traders reason to take some dollar positions off the table.
The main risks to the upside case are a sudden diplomatic resolution in the Middle East, which could reduce safe-haven demand quickly, or a labour market print on 3 April that is weak enough to revive recession concerns and push rate cut expectations higher again.
Penggerak terlemah: Dolar Selandia Baru (NZD)
Jika Anda ingin merancang mata uang yang akan berjuang di lingkungan saat ini, NZD cocok dengan brief hampir sempurna. Ini sensitif terhadap risiko. Ini terkait dengan komoditas. Ini menjalankan suku bunga kebijakan 2,25%, yang berada di bawah Fed dan sekarang di bawah RBA juga. Selandia Baru juga merupakan importir energi, sehingga kenaikan harga minyak menghantam neraca perdagangan dan prospek inflasi domestik pada saat yang bersamaan.
Tak satu pun dari hal-hal itu baru tetapi kombinasi dari semuanya sekaligus, dengan latar belakang dolar yang melonjak dan sentimen risiko yang luas, telah menekan NZD dengan cara yang sulit untuk diabaikan. Carry trade yang pernah membuat NZD menarik telah berbalik karena modal bergerak keluar, bukan masuk.
Key drivers
Energy import exposure:
Rising Brent crude hits New Zealand's trade balance directly and adds upside pressure to domestic inflation.
Yield gap:
The 2.25% Reserve Bank of New Zealand (RBNZ) policy rate sits below the Fed and the RBA, sustaining negative carry against both the USD and AUD.
Risk-off positioning:
As a commodity and risk currency, the NZD tends to underperform when global sentiment deteriorates.
Trade uncertainty:
Ongoing tariff related uncertainty continues to weigh on export sector confidence.
Risks and constraints
Any unexpected hawkish commentary from the RBNZ or a sharp decline in oil prices could provide some relief. A broader improvement in global risk appetite would also tend to benefit the NZD, given its sensitivity to sentiment shifts.
But the structural yield disadvantage is not going away quickly, and that may continue to limit the pair's recovery potential.
USD/JPY
USD/JPY adalah pasangan yang paling jelas menggambarkan apa yang terjadi ketika status safe-haven mata uang diganti oleh logika carry. Yen dulunya merupakan pelabuhan panggilan pertama bagi para pedagang yang mencari perlindungan selama tekanan geopolitik. Dinamika itu telah ditekan, dan alasannya sangat mudah: Anda melepaskan terlalu banyak hasil untuk menahan yen sekarang.
Suku bunga kebijakan Bank of Japan (BOJ) berada di 0,75% sementara Fed berada di 3,50% hingga 3,75% dan kesenjangan itu tidak mendorong aliran safe-haven. Ini mendorong pinjaman dalam yen dan penyebaran di tempat lain. Jadi sementara dolar naik karena risiko geopolitik, yen jatuh pada peristiwa yang sama. Bukan seperti itu seharusnya bekerja, tetapi begitulah cara kerja matematika ketika perbedaan hasil seluas ini.
USD/JPY berada di dekat 159, yang membuatnya tidak jauh dari level 160 yang secara konsisten ditandai oleh Kementerian Keuangan Jepang sebagai garis yang membutuhkan perhatian. Pertemuan BOJ pada 27 dan 28 April sekarang menjadi acara yang benar-benar langsung.
Key events to watch
Tokyo CPI, 30 March (AEDT):
March inflation data. A strong read may build the case for BOJ action at the April meeting.
BOJ meeting, 27 and 28 April (AEST):
Markets are treating this as a live event. The quarterly outlook report may include updated inflation forecasts that shift rate hike timing expectations.
Intervention watch:
Japan's Ministry of Finance has been explicit about the 160 level. Actual intervention, or a credible threat of it, could trigger a sharp and fast reversal.
What could shift the outlook
A hawkish BOJ, actual FX intervention, or a softer US CPI print that reduces dollar support could all push USD/JPY lower from current levels. On the other side, a dovish hold from the BOJ combined with continued dollar strength could see the pair test 160 and potentially beyond, which would likely intensify the intervention conversation in Tokyo.
For traders watching AUD/JPY and other yen crosses, the BOJ meeting on 27 and 28 April carries similar weight. A hawkish shift tends to compress yen crosses broadly, not just USD/JPY.
Data untuk ditonton selanjutnya
Empat acara menonjol sebagai katalis FX potensial paling jelas dalam minggu-minggu mendatang. Masing-masing memiliki saluran transmisi langsung ke ekspektasi suku bunga, dan ekspektasi suku bunga mendorong sebagian besar pergerakan FX saat ini.
Key dates and FX sensitivity
30
Mar
Tokyo CPI
JPY pairs, USD/JPY · AEDT
A strong read may strengthen the case for a more hawkish BOJ at the April meeting.
3
Apr
US labour market (NFP)
USD pairs, AUD/USD, NZD/USD · 10:30 pm AEDT
A weak result could revive recession concerns and alter Fed pricing.
10
Apr
US CPI - March
USD/JPY, EUR/USD, gold · 10:30 pm AEST
The most direct test of whether inflation is easing fast enough to reopen the rate cut conversation.
27-28
Apr
BOJ meeting and quarterly outlook report
JPY crosses, AUD/JPY · AEST
The key policy event for yen crosses. Updated inflation forecasts may shift rate hike timing expectations.
Level dan sinyal kunci
Ini adalah titik referensi yang paling diperhatikan oleh para pedagang dan pembuat kebijakan. Masing-masing mewakili pemicu potensial untuk pergeseran posisi atau respons resmi.
◆
DXY 100.00
A psychologically and technically significant support level. Holding above it may sustain the dollar's current run across major pairs. A break below it would likely signal a broader sentiment shift.
◆
USD/JPY 160.00
Japan's Ministry of Finance has consistently referenced this level as a threshold requiring attention. Actual intervention, or a credible threat of it, has historically been capable of producing sharp and fast reversals in the pair.
◆
Brent crude US$120
A move to this level would likely intensify risk off behaviour across FX markets, putting further pressure on energy importing currencies including the NZD, EUR, and JPY.
◆
AUD/USD 0.7000
This level has historically attracted buying interest and may act as a near term directional reference for positioning in the pair.
Bottom line
The FX moves heading into April were shaped by a combination of geopolitical shock, yield divergence, and a repricing of central bank expectations that few had positioned for at the start of the quarter. The dollar's dual role as a high yielding and safe haven currency has put it in an unusually strong position, but that position is not unconditional.
One soft CPI print, one diplomatic breakthrough, or one labour market miss could change the tone quickly. Currency moves may remain highly data dependent and sensitive to overnight news flow from the Middle East, where developments can gap markets before the next session opens.
Akses dunia FX yang lebih luas dan tetap fleksibel saat kondisi berubah. Buka akun · Masuk
Inilah situasinya saat April dimulai. Perang mempengaruhi salah satu titik sengatan minyak paling penting di dunia. Minyak mentah Brent diperdagangkan di atas US $100. Dan Federal Reserve (Fed), yang menghabiskan sebagian besar tahun 2025 untuk merancang pendaratan lunak, sekarang menghadapi ancaman inflasi yang didorong lebih sedikit oleh upah, jasa atau ekonomi domestik, dan lebih banyak lagi oleh energi. Ia menyaksikan kejutan minyak.
Suku bunga Fed berada di 3,50% hingga 3,75%. Pertemuan Komite Pasar Terbuka Federal (FOMC) berikutnya adalah pada 28 dan 29 April dan pertanyaan kunci untuk pasar bukanlah apakah Fed akan memotong, apakah Fed dapat memotong, atau apakah kejutan energi mungkin telah menutup pintu itu untuk sebagian besar tahun 2026.
Sejumlah besar rilis data utama mendarat pada bulan April. Indeks harga konsumen (CPI) Maret, penggajian non-pertanian (NFP) dan perkiraan awal produk domestik bruto (PDB) Q1 adalah tiga yang paling penting. Tetapi pernyataan FOMC pada 29 April mungkin merupakan rilis yang menentukan nada untuk sisa tahun ini.
Fed Funds Rate
3.50%–3.75%
Next FOMC
28–29 April 2026
Brent crude
Above US$100
Key data events
12 major releases
Pertumbuhan: Aktivitas bisnis dan permintaan
Pikirkan tentang seperti apa ekonomi AS yang akan datang tahun ini: belanja modal yang digerakkan oleh AI (capex) adalah bagian utama dari narasi pertumbuhan, niat investasi perusahaan tampak kuat dan Undang-Undang Bill One, Big, Beautiful sudah ada dalam campuran. Di atas kertas, kisah pertumbuhan tampak solid.
Kemudian situasi Selat Hormuz mengubah kalkulus. Bukan karena AS adalah importir energi bersih, bukan, dan isolasi struktural itu penting. Tetapi apa yang baik bagi produsen energi AS masih dapat menekan margin di tempat lain dan membebani permintaan global. Perkiraan produk domestik bruto (PDB) Q1 yang naik 30 April sekarang kemungkinan akan dibaca melalui dua lensa: seberapa kuat ekonomi sebelum guncangan, dan apa yang mungkin sinyalnya tentang kuartal mendatang.
Key dates (AEST)
2
Apr
US international trade in goods and services (February)
Bureau of Economic Analysis · 10:30 pm AEDT
Medium
30
Apr
Q1 GDP — advance estimate
Bureau of Economic Analysis · 10:30 pm AEST
High
What markets look for
Resilience in Q1 GDP despite the elevated interest rate environment and early energy cost pressures
Trade balance movements linked to shifting global tariff frameworks
Business investment intentions following passage of the "One Big Beautiful Bill Act"
Early signs of capacity constraints emerging in technology-heavy sectors
How this data may move markets
Scenario
Treasuries
USD
Equities
Stronger than expected growth
↑ Yields rise
↑ Firmer
Mixed - depends on inflation read
Softer growth/GDP miss
↓ Yields fall
↓ Softer
Risk off if stagflation narrative builds
Tenaga kerja: Gaji dan pekerjaan
Laporan pekerjaan Februari adalah, tergantung pada bagaimana Anda membacanya, baik blip atau tanda peringatan. Payroll non-pertanian (NFP) turun 92.000, pengangguran naik tipis menjadi 4,4% dan garis resmi adalah bahwa cuaca memainkan peran. Itu mungkin benar tetapi inilah yang juga terjadi. Pasar tenaga kerja tiba-tiba tampak sedikit kurang meyakinkan sebagai argumen utama untuk menjaga suku bunga tetap tinggi.
Laporan ketenagakerjaan 3 April untuk bulan Maret sekarang benar-benar konsekuensial. Kembali ke pertumbuhan gaji positif mungkin akan menenangkan saraf dan soft print kedua berturut-turut, terutama dengan latar belakang harga energi yang lebih tinggi, akan mulai membangun narasi yang sangat tidak nyaman bagi The Fed. Ini akan melihat pertumbuhan pekerjaan yang lebih lambat dan ancaman inflasi pada saat yang sama. Itu bukan tempat yang nyaman untuk berada.
Key dates (AEST)
3
Apr
March employment situation (NFP and unemployment rate)
Bureau of Labor Statistics · 10:30 pm AEDT
High
30
Apr
Q1 employment cost index
Bureau of Labor Statistics · 10:30 pm AEST
Medium
What markets look for
A return to positive payroll growth, or confirmation that February's softness was the start of a trend
Stabilisation or further movement in the unemployment rate from 4.4%
Average hourly earnings growth relative to core inflation — the wage-price dynamic the Fed watches closely
Weekly initial jobless claims as a real-time signal of whether layoff activity is rising
Inflasi: CPI, PPI dan PCE
Inilah kebenaran yang tidak nyaman tentang di mana inflasi berada saat ini. Pengeluaran konsumsi pribadi inti (PCE), ukuran pilihan The Fed, sudah berjalan pada 3,1% tahun ke tahun di bulan Januari, sebelum kejutan minyak terjadi. The Fed belum sepenuhnya menyelesaikan masalah inflasi, melainkan memperlambatnya. Itu adalah hal yang berbeda.
Dan sekarang, di atas masalah inflasi yang tidak sepenuhnya terpecahkan, harga minyak telah bergerak tajam lebih tinggi. Harga energi dapat dimasukkan ke dalam indeks harga konsumen (CPI) dengan relatif cepat, melalui biaya bensin, transportasi dan logistik yang pada akhirnya dapat muncul dalam harga hampir semua hal. CPI 10 April untuk Maret mungkin merupakan rilis data tunggal paling penting bulan ini, itu adalah yang mungkin memberi tahu kita apakah kejutan energi sudah muncul dalam angka yang ditonton oleh Fed.
Key dates (AEST)
10
Apr
Consumer price index (CPI) — March
Bureau of Labor Statistics · 10:30 pm AEST
High
14
Apr
Producer price index (PPI) — March
Bureau of Labor Statistics · 10:30 pm AEST
Medium
30
Apr
Personal income and outlays incl. PCE price index — March
Bureau of Economic Analysis · 10:30 pm AEST
High
What markets look for
Monthly CPI acceleration driven by energy and shelter components — the two stickiest inputs
PPI as a forward-looking signal: producer cost pressure tends to feed into consumer prices with a lag
PCE trends relative to the Fed's 2% target, particularly the core reading that strips out food and energy
Any sign that AI-related pricing power is feeding into corporate margins in ways that sustain elevated core readings
How this data may move markets
Scenario
Treasuries
USD
Gold
Cooling core inflation
↓ Yields fall
↓ Softer
↑ Supportive
Sticky or rising inflation
↑ Yields rise
↑ Firmer
↓ Headwind
Kebijakan, perdagangan, dan pendapatan
April juga merupakan awal musim pendapatan AS, dan hasil kuartal ini membawa bobot yang tidak biasa. Investor telah menuangkan modal ke infrastruktur AI atas dasar bahwa pengembalian akan datang. Pertanyaannya adalah kapan. Dengan volatilitas geopolitik yang mendorong rotasi menjauh dari teknologi yang berorientasi pada pertumbuhan dan menuju energi dan pertahanan, pendapatan JPMorgan Chase 14 April akan dibaca sebanyak apa yang dikatakan manajemen tentang lingkungan makro maupun angka-angka itu sendiri.
Kemudian ada pertemuan FOMC pada 28 dan 29 April. Setelah data awal April, termasuk NFP, CPI dan indeks harga produsen (PPI), The Fed akan memiliki lebih dari cukup informasi untuk memperbarui bahasanya. Apakah itu menandakan bahwa penurunan suku bunga dapat tetap ditunda hingga 2026, atau apakah itu membiarkan pintu sedikit terbuka, mungkin merupakan komunikasi paling konsekuensial pada kuartal ini.
Volatilitas geopolitik telah mendorong investor untuk menilai kembali posisi pertumbuhan yang berat. Diperkirakan pembangunan infrastruktur AI senilai US$650 miliar juga berada di bawah pengawasan yang lebih ketat pada pengembalian investasi. Jika musim pendapatan mengecewakan di bidang itu, dan jika FOMC menandakan penahanan yang berkepanjangan, kombinasi tersebut dapat menguji selera risiko menuju Mei.
Monitor this month (AEST)
◆
14 April - JPMorgan Chase Q1 earnings
The first major bank to report. Management commentary on credit conditions, consumer spending, and the macro outlook will set the tone for financial sector earnings and broader market sentiment.
◆
15 April - Bank of America Q1 earnings
A read on consumer credit conditions and household financial health, particularly relevant given rising energy costs and the 4.4% unemployment rate.
◆
28-29 April - FOMC meeting and policy statement
The month's most consequential event. The statement and any updated forward guidance may effectively confirm whether rate cuts remain a possibility for 2026.
◆
Ongoing - Strait of Hormuz tanker traffic
A live indicator of energy supply risk. Any escalation or resolution carries immediate implications for oil prices, inflation expectations, and the Fed's options.
◆
Ongoing - Sovereign AI export restrictions
Developing policy around technology export curbs may affect capital expenditure plans for US technology firms, with knock-on implications for growth and employment in the sector.
The Bigger Picture
Geopolitical volatility has forced a rotation into energy and defence at the expense of growth oriented technology positions. The estimated US$650 billion AI infrastructure buildout is increasingly being scrutinised for returns on investment. If earnings season disappoints on that front, and if the FOMC signals a prolonged hold, the combination could test risk appetite heading into May.
Rilis data besar AS ke depan? Tetap fokus. Buka akun · Masuk
Pasar Asia-Pasifik mulai April dengan fokus pada bagaimana gangguan berkepanjangan di Selat Hormuz mempengaruhi inflasi, arus perdagangan, dan ekspektasi kebijakan. Rencana Lima Tahun ke-15 China mengalihkan perhatian ke kecerdasan buatan dan kemandirian teknologi, dengan efek lanjutan bagi rantai pasokan dan pertumbuhan regional. Jepang dan Australia menghadapi tantangan mengelola inflasi energi impor sambil mengukur seberapa jauh mereka dapat menormalkan kebijakan tanpa menggagalkan permintaan domestik.
Bagi para pedagang, campuran kenaikan harga energi dan perbedaan kebijakan dapat membuat volatilitas tetap tinggi di seluruh indeks dan mata uang regional.
Key watchlist
Top China data point
March exports (14 April)
Top Japan event
BOJ rate decision (27-28 April)
Top Australia event
March quarter CPI (29 April)
Main regional wildcard
Sovereign AI trade restrictions
Most sensitive market
Nikkei 225 / USD/JPY
Key threshold
Brent crude above US$110
China
Anggota parlemen di Beijing telah menyetujui Rencana Lima Tahun ke-15 (2026-2030), menempatkan kecerdasan buatan (AI) dan kemandirian teknologi di pusat agenda nasional. Pemerintah telah menetapkan target pertumbuhan 4,5% hingga 5,0% untuk tahun 2026, yang terendah dalam beberapa dekade, karena memprioritaskan kualitas pertumbuhan daripada kecepatan.
APAC Sections — GO Markets (Webflow embed snippets)
Key dates (AEST)
13
Apr
M2 money supply and new yuan loans
People's Bank of China
Medium
14
Apr
March balance of trade
General Administration of Customs
High
16
Apr
Q1 GDP and March industrial production
National Bureau of Statistics
High
What markets look for
Evidence of technology-driven industrial production growth consistent with Five-Year Plan priorities
March export resilience in the face of shifting global tariff frameworks
Signs of stabilisation in domestic consumer retail sales
Any implementation detail on the "new-type national system" for AI development
Why it matters for the region
China's shift toward high-value manufacturing and AI self-sufficiency could reshape regional supply chains and influence demand for commodities. A stronger-than-expected trade surplus may support broader regional sentiment, although higher energy costs can pressure margins for Chinese exporters and weigh on import demand. The 16 April GDP release carries the most weight as the first quarterly read on whether the 4.5%-5.0% target is tracking.
Jepang
Bank of Japan (BOJ) menghadapi tekanan yang meningkat untuk menormalkan kebijakan karena inflasi yang didorong oleh energi berisiko kebangkitan. Sementara harga konsumen tidak termasuk makanan segar melambat menjadi 1,6% pada bulan Februari, lonjakan harga minyak baru-baru ini dapat mendorong indeks harga konsumen (IHK) kembali menuju target 2% dalam beberapa bulan mendatang.
Key dates (local / AEDT or AEST)
30
Mar
Tokyo CPI (March)
Statistics Bureau of Japan · Lead indicator for national trends (AEDT)
Medium
27–28
Apr
BOJ monetary policy meeting and outlook report
Bank of Japan · Live event for rate hike watch (AEST)
High
What markets look for
BOJ guidance on the timing of potential rate increases
March Tokyo CPI data as a lead indicator for national price trends
Updated inflation forecasts in the quarterly outlook report
Official comments on yen volatility and any reference to intervention thresholds
Why it matters
The BOJ remains a global outlier, with its short-term policy rate held at 0.75% after the March meeting, and any hawkish shift could trigger sharp moves in forex pairs involving the yen. Markets are weighing whether the BOJ can tighten policy while the government simultaneously resumes energy subsidies to shield households from rising oil costs. These competing pressures make the April meeting and outlook report unusually informative.
Australia
Perekonomian Australia tetap dalam keadaan divergensi dua kecepatan, dengan rumah tangga yang lebih tua meningkatkan pengeluaran sementara kelompok yang lebih muda menghadapi tekanan keterjangkauan yang signifikan. Menyusul kenaikan suku bunga Reserve Bank of Australia (RBA) menjadi 4.10% pada bulan Maret, pasar sangat fokus pada data inflasi mendatang untuk menilai apakah pengetatan tambahan mungkin diperlukan.
Key dates (AEST)
16
Apr
March unemployment rate
Australian Bureau of Statistics · 11:30 am AEST
Medium
29
Apr
March quarter CPI (Q1)
Australian Bureau of Statistics · 11:30 am AEST
High
30
Apr
March producer price index (PPI)
Australian Bureau of Statistics · 11:30 am AEST
Medium
What markets look for
Whether Q1 underlying inflation remains above the RBA's 2%-3% target band
Labour market resilience in the face of rising borrowing costs
The pass-through of global energy prices into domestic transport and logistics costs
RBA minutes (31 March) for any signal of internal policy disagreement
Why it matters
The 29 April CPI release may be the most consequential domestic data point before the RBA's May meeting. If inflation proves sticky or accelerates due to global energy shocks, the probability of a further rate increase could rise, with implications for both the Australian dollar and volatility across the ASX 200. The PPI reading the following day may also provide early signal on whether producer-level cost pressures are building in the pipeline.
Regional themes
◆
ASEAN demand signals
March trade data from Singapore and Malaysia may indicate whether regional electronics demand is holding up amid global uncertainty.
◆
India growth trajectory
Elevated energy costs could weigh on India's 2026 expansion plans, particularly following the New Delhi AI summit and associated infrastructure commitments.
◆
Commodity sentiment
Iron ore and thermal coal prices remain sensitive to signals from China's industrial policy and the pace at which Five-Year Plan priorities translate into actual demand.
◆
Currency pressure
Energy-importing economies across Asia and Europe may face sustained currency headwinds if Brent crude holds above US$100 for an extended period.
Lacak tema Asia-Pasifik dan memantau gerakan saat mereka terbuka. Buka akun · Masuk
Pengumuman gencatan senjata 8 April dan diskusi paralel seputar gencatan senjata 45 hari belum menyelesaikan gangguan Selat Hormuz. Mereka, untuk saat ini, membatasi skenario terburuk, tetapi lalu lintas tanker tetap pada sebagian kecil dari tingkat normal dan permintaan Iran untuk biaya transit menandakan perubahan struktural, bukan yang sementara.
Apa yang dimulai sebagai konflik regional telah menjadi kejutan energi global, dan pertanyaan bagi pasar bukan lagi apakah Hormuz terganggu, tetapi seberapa permanen gangguan itu mengubah dasar harga untuk minyak.
Kuncinya yang menarik
Sekitar 20 juta barel per hari (bpd) minyak dan produk minyak bumi biasanya melewati Selat Hormuz antara Iran dan Oman, setara dengan sekitar seperlima dari konsumsi minyak global dan sekitar 30% dari perdagangan minyak laut global.
Ini adalah kejutan aliran, bukan masalah inventaris. Pasar minyak bergantung pada throughput berkelanjutan, bukan penyimpanan statis.
Jika gangguan berlanjut lebih dari beberapa minggu, Brent dapat bergeser dari lonjakan jangka pendek ke guncangan harga yang lebih luas, dengan risiko stagflasi.
Lalu lintas kapal tanker melalui selat turun dari sekitar 135 kapal per hari menjadi kurang dari 15 kapal pada puncak gangguan, pengurangan sekitar 85%, dengan lebih dari 150 kapal berlabuh, dialihkan, atau tertunda.
Gencatan senjata dua minggu diumumkan pada 8 April, dengan negosiasi gencatan senjata selama 45 hari sedang berlangsung. Iran secara terpisah telah mengisyaratkan permintaan biaya transit pada kapal-kapal yang menggunakan selat, yang, jika diformalkan, akan mewakili dasar geopolitik permanen pada biaya energi.
Pasar telah mulai berputar menjauh dari pertumbuhan dan eksposur teknologi terhadap nama energi dan pertahanan, mencerminkan pandangan bahwa kenaikan minyak menjadi biaya struktural daripada premi risiko sementara.
Institutional Grade Performance
Master the Markets with MetaTrader 5
Trade hundreds of instruments with superior speed and advanced technical analysis. Harness full EA functionality to execute your strategy.
Selat Hormuz menangani sekitar 20 juta barel per hari minyak dan produk minyak bumi, setara dengan sekitar 20% dari konsumsi minyak global dan sekitar 30% dari perdagangan minyak laut global. Dengan permintaan minyak global mendekati 104 juta barel per hari dan kapasitas cadangan terbatas, pasar sudah seimbang sebelum eskalasi terbaru.
Selat ini juga merupakan koridor penting untuk gas alam cair. Sekitar 290 juta meter kubik LNG transit setiap hari rata-rata pada tahun 2024, mewakili sekitar 20% dari perdagangan LNG global, dengan pasar Asia sebagai tujuan utama.
Badan Energi Internasional (IEA) telah menggambarkan Hormuz sebagai titik henti transit minyak yang paling penting di dunia, mencatat bahwa bahkan gangguan sebagian dapat memicu pergerakan harga yang terlalu besar. Minyak mentah Brent telah bergerak di atas US $100 per barel, mencerminkan keketatan fisik dan kenaikan premi risiko geopolitik.
Sumber: Administrasi Informasi Energi AS, tanggal 17 Juni 2025, menggunakan rata-rata harian 2024
Kapal tanker menganggur karena aliran lambat
Data pengiriman dan asuransi sekarang menunjukkan ketegangan secara real time. Lebih dari 85 kapal induk minyak mentah besar dilaporkan terdampar di Teluk Persia, sementara lebih dari 150 kapal telah berlabuh, dialihkan atau ditunda karena operator menilai kembali keselamatan dan asuransi. Itu akan meninggalkan sekitar 120 juta hingga 150 juta barel minyak mentah menganggur di laut.
Volume tersebut hanya mewakili enam hingga tujuh hari throughput Hormuz normal, atau sedikit lebih dari satu hari konsumsi minyak global.
Data pengiriman dan asuransi yang diperbarui sekarang mengkonfirmasi lebih dari 150 kapal telah berlabuh, dialihkan, atau tertunda, naik dari 85 yang awalnya dilaporkan. Cakupan konsumsi global 1,3 hari dari minyak mentah yang tidak digunakan tetap menjadi kendala yang mengikat: ini adalah kejutan aliran, bukan masalah penyimpanan, dan gencatan senjata belum diterjemahkan ke dalam throughput yang dipulihkan secara bermakna.
🌋 Trump, volatility and Hormuz.
As tariff shocks collide with a ten year extreme in oil positioning, the margin for error is zero. See the technical markers and safe haven pivots defining the current risk environment.
Pasar yang dibangun di atas aliran, bukan penyimpanan
Pasar minyak berfungsi pada pergerakan terus menerus. Kilang, pabrik petrokimia, dan rantai pasokan global dikalibrasi untuk pengiriman yang stabil di sepanjang jalur laut yang dapat diprediksi. Ketika aliran melalui titik henti yang membawa sekitar seperlima dari konsumsi minyak global dan sekitar 30% dari perdagangan minyak laut global terganggu, sistem dapat bergerak dari keseimbangan ke defisit dalam beberapa hari.
Kapasitas produksi cadangan, sebagian besar terkonsentrasi di OPEC, diperkirakan hanya 3 juta hingga 5 juta barel per hari. Itu jauh di bawah volume yang berisiko jika aliran Hormuz sangat terganggu.
GO Markets — Idle Tankers: Days of Cover
Oil market analysis
How long do idle tankers last?
135M idle barrels — days of cover against each demand benchmark
vs. Strait of Hormuz daily flow (20M bbl/day)
6.75 daysof Hormuz throughput covered
6.75 days
0
5
10
15
20
25
30 days
vs. Global oil consumption (104M bbl/day)
1.3 daysof world demand covered
1.3 days
0
5
10
15
20
25
30 days
vs. US Strategic Petroleum Reserve release (1M bbl/day)
135 daysof full SPR release pace covered
135 days — but SPR exists to replace this role
0
5
10
15
20
25
30 days
135M
idle barrels on tankers (midpoint of 120–150M range)
~33%
of daily Hormuz flow that is idle storage, not transit
<31 hrs
is all idle storage against global daily consumption
Indicative market trajectories based on disruption severity
Scenarios for the weeks ahead
1–2 WEEKS
Ceasefire catch-up
Markets face catch-up repricing. Brent could consolidate in the US$105–US$115 range as risk premia unwind. Brent may trade lower (US$95–US$110) if strategic stocks bridge the temporary shortfall.
2–4 WEEKS
Infrastructure blitz
Shifts to structural supply shock. Brent moving toward US$150–US$200 cannot be ruled out. This is the stagflation trigger where energy costs constrain central bank flexibility.
STRUCTURAL
Geopolitical floor
Iran's transit fee demand creates a permanent input cost. The pre-crisis price structure (US$60–US$70) may not return, embedded in insurance and freight rates.
Critical Threshold
US$120 remains the level at which energy inflation becomes a direct Federal Reserve policy problem.
Risiko inflasi dan limpahan makro
Dampak inflasi dari kejutan minyak biasanya datang dalam gelombang. Harga bahan bakar dan energi yang lebih tinggi dapat mengangkat inflasi utama dengan cepat karena biaya bensin, solar, dan listrik bergerak lebih tinggi.
Seiring waktu, biaya energi yang lebih tinggi dapat melewati pengiriman, makanan, manufaktur, dan layanan. Jika gangguan berlanjut, kombinasi peningkatan inflasi dan pertumbuhan yang lebih lambat dapat meningkatkan risiko lingkungan stagflasi dan membuat bank sentral menghadapi pertukaran yang sulit.
🛢️ Brent hits $100.
Exxon and SLB are leading the rotation out of tech. Get the price targets and technical support levels for the top 5 energy majors.
Tidak ada offset yang mudah, sistem dengan sedikit kelonggaran
Apa yang membuat episode saat ini sangat akut adalah kurangnya kelonggaran dalam sistem global.
Pasokan dan permintaan global mendekati 103 juta hingga 104 juta barel per hari meninggalkan sedikit bantalan cadangan ketika chokepoint penanganan hampir 20 juta barel per hari, atau sekitar seperlima dari konsumsi minyak global, terganggu. Diperkirakan kapasitas cadangan 3 juta hingga 5 juta barel per hari, sebagian besar di dalam OPEC, hanya akan mencakup sebagian kecil dari volume yang berisiko.
Rute alternatif, termasuk jaringan pipa yang melewati Hormuz dan mengalihkan rute pengiriman, hanya dapat mengimbangi sebagian arus yang hilang, dan biasanya dengan biaya yang lebih tinggi dan dengan waktu tunggu yang lebih lama.
Intinya
Sampai transit melalui Selat Hormuz dipulihkan dan dipandang aman secara kredibel, aliran minyak global kemungkinan akan tetap terganggu dan premi risiko meningkat. Bagi investor, pembuat kebijakan dan pembuat keputusan perusahaan, pertanyaan intinya adalah apakah minyak dapat bergerak ke tempat yang seharusnya, setiap hari, tanpa gangguan.
Market Opportunity
Don't just watch the squeeze. Trade the framework.
As positioning gaps hit decade extremes, access advanced charting tools and real time execution on the six key markets defining this cycle.
Sebuah berita utama tentang peradaban yang “sekarat malam ini” dibangun untuk membanjiri, tetapi sinyal yang lebih jelas mungkin adalah ketenangan di bawahnya, karena pasar mulai memperlakukan siklus eskalasi tajam ini diikuti oleh de-eskalasi mendadak sebagai pola, bukan kejutan.
Dalam lingkaran makro, pola itu memiliki label tumpul: TACO, atau “Trump Always Chickens Out”. Frasa dimuat, tetapi logikanya sederhana. Ancaman tekanan maksimum melanda, aset berisiko goyah, kemudian jeda, penundaan atau hasil yang lebih lembut muncul begitu biaya ekonomi mulai menggigit.
Itu tidak berarti risikonya kecil. Ini mungkin hanya berarti investor telah terbiasa dengan naskah di mana retorika berkobar, pasar menyerap guncangan, dan pengekangan muncul sebelum skenario terburuk sepenuhnya muncul.
Developing situation
|
Strait of Hormuz | Section 122 Tariffs
PublishedApril 2026
Brent CrudeAbove US$100
VIX31
In focus6 markets
Oil PositioningDecade-low longs
The Framework & MechanismIs the market the red line?
+
This is where the TACO idea starts to matter. Traders are not just watching the rhetoric. They are watching when it starts to hit markets, inflation and the wider economy.
Oil is at the centre of that risk. If disruption around the Strait of Hormuz starts to threaten global energy flows, the story quickly becomes macro. Higher oil can lift inflation expectations, pressure central banks and tighten financial conditions.
That is why a pause can look less like diplomacy and more like pressure relief. The real red line may be the point where the economic damage becomes too obvious to ignore.
Short Squeezed
Positioning adds another layer. Oil still looks under-owned, with futures positioning near decade-long bearish extremes. If a fresh shock lands, short-covering could drive prices higher much faster than fundamentals alone would suggest.
That is the short-squeeze risk. In the Commitment of Traders (COT) report, recent data suggests oil long exposure is relatively low by historical standards.
Humanitarian Reality
Whatever may be promised in political messaging, any sustained conflict in Iran would carry a heavy cost in displacement, infrastructure damage and wider regional stress. A relief rally in markets does not change that.
Global Isolation
Even if pauses are used to steady domestic market sentiment, allies and multilateral institutions may view bluff-and-retreat tactics as a credibility problem that creates longer-term diplomatic friction.
Positioning gap indicator
Divergence analysis between positioning and risk environment
APRIL 2026
Bars show GO Markets’ internal estimate of the divergence between current futures positioning and levels seen in comparable historical shock environments.
Brent crudeExtreme
Gold (XAU/USD)Very high
Nasdaq 100High
USD/CNHHigh
US 10 yr yieldMedium
USD/CADMedium
Extreme decade scale positioning extreme
High significant divergence
Medium moderate divergence
Methodology note
The Positioning Gap Indicator is based on GO Markets’ internal analysis and is intended as a high-level, illustrative framework only. It uses a combination of market positioning data, historical comparisons and discretionary assumptions about how similar energy and trade shocks have affected markets in the past. The ‘Extreme’, ‘Very High’, ‘High’ and ‘Medium’ labels are relative internal classifications, not objective market standards, and should not be relied on as predictions, forecasts or a guarantee of future outcomes.
The Six Markets
The six markets that matter most
Each of these six markets is exposed to the current situation through a different mechanism. Understanding the mechanism, not just the price, matters. It helps explain whether a move is a headline reaction or the start of something broader. Tap any card to expand the full analysis.
01
BRENT
Brent crude oil
ENERGYDIRECT CHANNELSQUEEZE RISK: EXTREME
+
The Clear Transmission Channel
Brent is the international benchmark for crude and the most direct transmission mechanism in this geopolitical thesis. Any disruption to physical flows, particularly through the Strait of Hormuz, forces an immediate tightening of global energy supply.
The Positioning Backdrop
Futures positioning currently sits at a ten year bearish extreme. Leveraged funds have cut long exposure heavily. In the event of a physical supply shock, this imbalance creates the potential for a violent short covering squeeze.
● Bull Case
Hormuz disruption extends beyond four weeks. Extended disruption could lift Brent sharply if supply flows are impaired for longer.
● Bear Case
Diplomatic intervention reopens the strait quickly. Strategic petroleum reserve (SPR) releases and increased spare capacity cap any price rally.
Strategic Marker
US$120: the point at which energy inflation becomes a direct Federal Reserve policy problem, rather than just a market narrative.
02
XAU/USD
Gold
SAFE HAVENUNDER-OWNEDSQUEEZE RISK: VERY HIGH
+
The Counter-Intuitive Setup
Despite a clear geopolitical risk profile, leveraged funds have been reducing bullish gold exposure. This leaves the market under-owned at the exact moment the fundamental case for safe haven assets is strengthening.
The Inflation Variable
The critical factor for Gold is whether energy-driven inflation limits the Fed's room to maneuver. If policy flexibility weakens, Gold could catch up quickly as a hedge against stagflation.
● Bull Case
Real yields fall as energy inflation outpaces rate hikes. Under-owned positioning amplifies the catch up move as institutional funds rebuild exposure.
● Bear Case
Geopolitical tensions ease rapidly. The Fed remains credibly focused on inflation, keeping real yields positive and supporting the USD over Gold.
Strategic Marker
One level to monitor is prior resistance, alongside any change in COT positioning.
03
US100/NAS100
Nasdaq 100
TECHNOLOGYDUAL PRESSURERATE AND SUPPLY RISK
+
Why it is a complicated position
The Nasdaq faces immediate pressure from two fronts: Stickier energy-driven inflation forces rates higher for longer, compressing multiples, while trade tensions unsettle the supply chains beneath major tech names.
Why the 10 year yield matters here
When the 10 year Treasury yield holds above 4.5%, the future value of technology earnings must be discounted at a higher rate. AI linked earnings momentum must overpower this valuation headwind.
● Bull Case
Earnings season delivers proof of AI investment generating real revenue. Index components successfully insulate supply chains, and AI capex momentum overrides the macro headwind.
● Bear Case
Energy inflation keeps yields above 4.5%. Multiple compression in high valuation names triggers a broader index decline amid disappointments in AI monetization.
Strategic Marker
S&P 500 at 6,498: a widely watched Fibonacci cluster. A sustained move below this threshold highlights a historically challenging framework for growth equities.
04
USD/CNH
US dollar/offshore Chinese yuan
FXBEIJING READPOLICY PROXY
+
What it tells you
USD/CNH is the cleanest real time read on how Beijing is responding to tariff pressure. A sharp rise suggests China is allowing currency weakness to absorb the costs of trade friction.
Why it matters beyond China
A move in USD/CNH doesn't stay contained. It spills into Asian equities, commodity demand, and broader risk appetite. Deliberate depreciation signals a shift in the global trade environment.
● USD Bull / Yuan Bear
Beijing allows yuan weakness as a deliberate countermeasure. Capital outflows accelerate, and USD safe haven demand reinforces the move.
● Yuan Recovery
Trade negotiations begin and a face saving off ramp is found. PBOC intervention defends the yuan, and the dollar's safe haven premium fades.
Strategic Marker
7.30 on USD/CNH: a sustained move above this has historically been associated with broader risk off moves in Asian markets.
05
US10Y/TNOTE
US 10 year Treasury yield
RATESMACRO PLUMBINGSHAPES EVERYTHING ELSE
+
Why it sits under everything
The 10 year yield shapes mortgage costs, corporate borrowing, and the valuation framework for risk assets globally. When it rises, borrowing becomes more expensive across the entire system.
The Independent Movement Risk
If oil forces the Fed to delay cuts, the 10 year yield could rise regardless of Fed communication. It can tighten financial conditions even before a formal policy shift occurs.
● Rates Fall Case
Oil shock proves transient. Fed maintains guidance and 10 year yields pull back toward 4.0%, relieving pressure on equities and providing support for bonds.
● Rates Rise Case
Sustained oil above US$100 pushes inflation higher. Fed pauses rate cut language and the 10 year yield breaks above 4.5%, compressing equity multiples.
Strategic Marker
4.5% on the 10 year yield: a sustained break above this while oil remains above US$100 is a historically challenging combination for equities.
06
USD/CAD
US dollar/offshore Canadian dollar
FXOIL-LINKEDLEAD INDICATOR
+
The Double Exposure
USD/CAD is a lead indicator because Canada sits at the intersection of energy and trade. It benefits from higher oil revenue but is highly sensitive to US economic and trade conditions.
When the Forces Collide
When oil rises, the CAD often strengthens; when trade stress rises, it weakens. In the current environment, these forces are colliding rather than canceling each other out.
● CAD Strengthens
Oil sustained above US$100 boosts export revenue while trade tensions stay short of Canada specific tariffs. Bank of Canada holds rates steady.
● CAD Weakens
Safe haven USD demand outweighs the oil benefit. Bank of Canada cuts rates to offset trade headwinds.
Strategic Marker
1.42 on USD/CAD: a sustained move above this signals trade anxiety is dominating the oil benefit, often preceding broader risk off moves.
What could go wrong
Four reasons the market logic could fail
+
A coherent macro case is still only a case. Markets regularly ignore tidy narratives for longer than expected, or invalidate them quickly. Four failure paths stand out.
1
The situation de-escalates faster than the news cycle suggests
Geopolitical risk premia can build slowly and disappear quickly. Any credible sign of de-escalation, especially around shipping lanes or energy infrastructure, could reverse oil sharply and drain urgency from the rest of the thesis. This is precisely the scenario the TACO framework predicts.
2
Tariff posturing does not become tariff policy
The market may be reacting to opening positions rather than settled policy. If Washington and Beijing find a face-saving off-ramp, as they have in previous trade disputes, currency and equity moves that anticipated escalation could unwind just as fast as they built.
3
AI investment spending overrides the macro headwind
Technology capital expenditure has remained more resilient than expected for much of the past two years. If earnings season shows that AI infrastructure spending is still translating into real demand and returns, the growth narrative may reassert itself, particularly in the Nasdaq 100.
4
The squeeze never arrives: extended positioning holds for longer than expected
Stretched positioning does not automatically produce a violent reprice. Markets can stay under-owned for months if risk appetite remains weak and institutions are unwilling to rebuild exposure. The set-up can exist without the catalyst arriving in a way that forces the move.
Forward Calendar
What to watch and when
+
Three time horizons matter here. The first tests supply resilience. The second tests financial system health. The third tests whether any shift in market leadership is cyclical or structural.
Three horizon watchlist
Signals and catalysts across the next two months
Next Two Weeks
Chipmaker guidance and supply commentary
Major semiconductor earnings calls will offer an early read on whether supply bottlenecks are worsening and whether management teams are changing production assumptions. If supply commentary deteriorates, the inflation story gets another push and the case for higher for longer rates strengthens.
Next 30 Days
Bank earnings and loan demand
Major US banks will provide a useful check on whether capital spending related to AI infrastructure is still being financed. The most important signal may not be earnings per share. It may be commercial loan demand. If businesses are pulling back on borrowing, the growth cycle may be softening earlier than the market expects.
Next 60 Days
Enablers versus spenders
The more structural test is whether the market begins rewarding businesses that produce physical outputs: energy producers, hardware makers and defence contractors, while penalising software companies that still cannot prove a clear return on AI spending. A wider performance gap between those groups would suggest something deeper than a temporary rotation.
Jalan di depan
Konvergensi ketegangan geopolitik dan posisi ekstrem historis saat ini telah menciptakan lingkungan “mata air melingkar” yang unik untuk pasar global. Sementara TACO kerangka kerja menunjukkan pola eskalasi tajam diikuti oleh jeda strategis, ujian nyata bagi pedagang selama 60 hari ke depan adalah transisi dari volatilitas yang digerakkan oleh headline ke rotasi pasar struktural.
Apakah celah posisi ditutup melalui de-eskalasi lembut atau tekanan pendek yang keras, memiliki kerangka reaksi yang ditentukan dapat membantu pedagang menavigasi kebisingan.
Market Opportunity
Don't just watch the squeeze. Trade the framework.
As positioning gaps hit decade extremes, access advanced charting tools and real time execution on the six key markets defining this cycle.
Jadi inilah masalahnya: musim pendapatan AS April tiba di pasar yang masih terasa sama sekali tidak normal. Seperti yang dijelaskan GO Markets di Buku pedoman pendapatan AS global: Panduan penting untuk pedagang, periode pelaporan ini mendarat setelah perubahan nyata dalam apa yang dipedulikan pasar. Ini bukan lagi hanya tentang mengejar pertumbuhan dengan biaya berapa pun. Ini tentang apa yang dikatakan angka-angka di bawah permukaan.
Dan pada tahun 2026, sinyal-sinyal itu bertabrakan dengan latar belakang gesekan tinggi:
Konflik geopolitik: Ketegangan yang sedang berlangsung di Timur Tengah
Kejutan pasokan minyak: Minyak mentah Brent di atas US $100
The Fed: Bank Sentral Masih Terkena Inflasi
Pivot daya tahan
Ya, AI masih menjadi cerita utama pasar tetapi masih mesin mencolok yang mendapatkan sebagian besar perhatian. Tapi di bawahnya, ada langkah yang lebih tenang menuju perusahaan yang terlihat dibangun untuk bertahan lebih baik ketika kondisinya semakin sulit.
Ketika tarif tidak pasti dan pasar energi berada di bawah tekanan, nama-nama seperti JPMorgan Chase dan kontraktor pertahanan utama mulai membawa lebih banyak bobot. Mereka tidak menggantikan narasi AI, melainkan, mereka menjadi bagian dari cara pedagang membaca selera risiko, daya tahan pendapatan dan, pada akhirnya, di mana pasar mencari sesuatu yang lebih solid untuk dipertahankan.
!
Important: Reporting schedules can change without notice. Reporting dates and release times are from company investor relations calendars where marked Confirmed; otherwise they are GO Markets estimates. Consensus EPS, revenue and analyst-range data are from third-party market consensus sources, as of 7 April 2026 (AEDT). Company guidance, backlog and operating metrics are from the latest company filings or results presentations unless stated otherwise. Figures and schedules may change without notice.
$JPM| Q1 2026 REPORTING PERIOD
JPMorgan Chase & Co.
NYSE | Financial Services | 14 Apr 2026
Confirmed
Global Release Countdown (BMO)
00:00:00:00
Consensus EPS
US$5.42
Consensus Revenue
US$47.88bn
AU/ASIA14 Apr | 8:45 pm
US/LATAM14 Apr | 6:45 am
Market Intelligence: $JPM
Analysis: JPM price drivers and scenarios
NII guidance
~US$103 billion
Full year | US$95 billionn ex:markets
ROTCE target
17%
Possible return on tangible common equity
Analyst range
US$5.02-5.70
Low to high estimate spread
AVG
LOW US$5.02AVG US$5.39HIGH US$5.70
The analyst spread of US$0.68 signals genuine disagreement about how the rate environment is flowing through to margins. A result above consensus but below the high end estimate may produce a muted reaction. A result above US$5.70 may shift the discussion.
Key swing factors for the result
Net interest income (NII)
The clearest macro lever. It reflects the gap between lending rates and deposit costs.
Guidance: US$103 billion for the full year
Return on tangible common equity (ROTCE)
A scale check. It indicates whether JPM is converting scale into efficiency. 17% is the benchmark.
Target: 17% ROTCE
Trading and investment banking
Strong Q1 growth was expected in fees and markets revenue. These lines can offset softness in lending, and stronger-than-expected performance here may shift the narrative away from rate sensitivity.
Watch: investment banking (IB) fees versus the prior quarter
Expense discipline
A bank can beat the EPS estimate and still sell off if expense growth is running too hot. Pairing the EPS result with the expense trajectory gives a fuller read on whether the beat is durable.
Watch: Expense outlook commentary
Trade Execution: $JPM
Earnings reaction framework: Q1 2026
Bull case
EPS above US$5.70, NII on track | ROTCE at or above 17%
The result comes in above the top of the analyst range. NII guidance holds or is revised higher. IB fees and markets revenue show strong Q1 growth. Expense commentary is constructive.
Possible reaction: momentum and repositioning
Base case
EPS between US$5.39 and US$5.70, NII in line | ROTCE near target
The result beats consensus but stays within the expected range. NII tracks guidance. The tone of the conference call may matter more than the headline number. The first move may fade if guidance is unchanged.
Possible reaction: muted or mixed initial response
Bear case
EPS below US$5.39 | NII misses | Expense growth surprises
The result comes in at or below the consensus midpoint. NII guidance is cut or qualified. Expense growth comes in above market expectations. IB or markets revenue disappoints.
Possible reaction: earnings multiple repricing
Reaction trigger to watch: The market response in the first 30 minutes after the result may indicate which scenario traders are leaning towards. A move above the prior session high on volume may support the bull case. A fade back into the range after an initial pop may point to the base case. A break below the prior session low on volume may suggest the bear case is gaining traction.
Sentiment Analysis · JPMorgan Chase
Interactive scenario analysis: $JPM
Select earnings outcome
Growth momentum
AI-linked offset, beat supported by NII and ROTCE
Stronger-than-expected demand for AI-related industrial lending may offset softer mortgage activity. Management maintains guidance as NII remains resilient in higher-for-longer conditions. IB fees and markets revenue may provide additional support. ROTCE at or above 17% would suggest the bank is converting scale into earnings efficiently.
EPS Outcome
Above US$5.70
NII Signal
On track
ROTCE
At or above 17%
Likely Reaction
Momentum may build
Sources & Data Methodology
Sources: Reporting dates and release times are from company investor relations calendars where marked Confirmed; otherwise they are GO Markets estimates. Consensus EPS, revenue and analyst-range data are sourced from Bloomberg and Earnings Whispers, as at 7 April 2026 (AEDT). Company guidance, backlog and operating metrics are sourced from the latest company filings, results presentations or investor relations materials unless stated otherwise. Any scenario analysis reflects GO Markets analysis. Figures and schedules may change without notice.
From credit to defence
If JPMorgan gives the market an early read on the consumer, credit quality and business activity, the defence names may be telling a different story. This is the point where the focus may start to shift from the credit cycle to government-backed demand.
In a market still shaped by geopolitical risk, that matters. Long-dated programs can help support revenue visibility, even when the broader outlook looks less certain. That is one reason the sector remains on the watchlist.
$LMT| Q1 2026 REPORTING PERIOD
Lockheed Martin Corp.
NYSE | Aerospace | Defense | 22 Apr 2026
Estimated
Global Release Countdown (BMO)
00:00:00:00
Consensus EPS
US$6.50
Consensus Revenue
US$16.32bn
AU | ASIA22 Apr | 9:20 pm
US | LATAM22 Apr | 7:20 am
Market Intelligence: $LMT
Analysis: LMT price drivers and scenarios
Order backlog
US$194 billionn
Record visibility
Book-to-bill
1.2x
Orders outpacing sales
Analyst range
US$6.90-7.10
Low to high estimate spread
AVG
LOW ~US$6.90AVG ~US$6.94HIGH US$7.10+
The consensus sits near the lower end of the analyst range. That positioning may leave room for upside if backlog growth and F-35 delivery timelines support execution. A print near the high end, above US$7.10, may extend the move, although the reaction would still depend on guidance and margins.
Key swing factors for the result
Backlog visibility
Primary evidence of demand. Book-to-bill above 1.2x would support full-year guidance and the production ramp.
Backlog: US$194 billion record
Free cash flow (FCF)
Defence stocks are often assessed on cash conversion. The market may look for confirmation of the US$6.5 billion floor.
Guide: US$6.5 billion - $6.8 billion
Missile segment growth
PrSM and THAAD deliveries remain key watchpoints. Strong space margins may help offset softness in aeronautics.
Watch: Fire Control margins
Margin pressure
Pension charges and production inflation remain risks. An earnings beat may fade if operating margins contract.
The result clears the upper half of the analyst range. Management reaffirms or raises the full-year FCF outlook. Strong Missiles and Fire Control (MFC) margins help offset any aeronautics supply chain lag.
Possible reaction: momentum may build and positioning may improve
Base case
EPS between US$6.30 and US$6.70 | Backlog steady at about US$194 billion
The result aligns with the US$6.38 consensus. F-35 delivery pace remains on track but offers no meaningful upside surprise. The market may wait for more specific segment guidance on the conference call.
Possible reaction: muted or mixed initial response
The result falls towards the bottom of the analyst spread. Management cites further software delays or program losses. The FCF trajectory narrows towards the lower end of previous expectations.
Possible reaction: the share price may come under pressure
Reaction trigger to watch: The market response in the first 30 minutes after the result may indicate which scenario traders are leaning towards. A move above the prior session high on volume may support the bull case. A fade back into the range after an initial pop may point to the base case. A break below the prior session low on volume may suggest the bear case is gaining traction.
Sentiment Analysis · Lockheed Martin
Interactive scenario analysis: $LMT
Select earnings outcome
Backlog confirmed
Backlog and FCF confirmation may support continuation
EPS clears the top of the analyst range. Backlog holds at or above US$194 billion and book-to-bill stays above 1.2, which would suggest orders are replenishing faster than revenue is being recognised. FCF guidance holds within the stated range.
EPS outcome
Above US$7.00
Backlog signal
Above US$194 billion
FCF guide
Holds or improves
Likely reaction
Continuation may follow
Sources & Data Methodology
Sources: Reporting dates and release times are from company investor relations calendars where marked Confirmed; otherwise they are GO Markets estimates. Consensus EPS, revenue and analyst-range data are sourced from Bloomberg and Earnings Whispers, as at 7 April 2026 (AEDT). Company guidance, backlog and operating metrics are sourced from the latest company filings, results presentations or investor relations materials unless stated otherwise. Any scenario analysis reflects GO Markets analysis. Figures and schedules may change without notice.
Not all defence names are the same
Lockheed Martin and Northrop Grumman may sit in the same defence bucket, but the market does not always read them the same way. Lockheed is more closely tied to the F-35 and current air combat demand. Northrop is more closely linked to next-generation programs such as the B-21 Raider and Sentinel.
That gives this section its contrast. One is often read through the lens of current defence demand. The other is more closely tied to longer-cycle strategic modernisation.
$NOC| Q1 2026 REPORTING PERIOD
Northrop Grumman Corp.
NYSE | Defense | Space Systems | 23 Apr 2026
Estimated
Global Release Countdown (BMO)
00:00:00:00
Consensus EPS
US$6.12
Consensus Revenue
US$10.24 bn
AU | ASIA23 Apr | 10:30 pm
US | LATAM23 Apr | 8:30 am
Market Intelligence: $NOC
Analysis: NOC price drivers and scenarios
Consensus EPS
US$6.96
Quarterly analyst average
Order Backlog
US$95.7 billion
Record revenue visibility
FY 2026 EPS guide
US$27.40-US$27.90
Full-year 2026 outlook
AVG
LOW ~US$6.90AVG ~US$6.96HIGH US$7.20+
The consensus sits near the lower end of the analyst range. That offers a quick visual for whether the result is merely in line or strong enough to ease the guidance concerns that weighed on the stock after its last update. A result above US$7.20 may shift the conversation more materially.
Key swing factors for the result
Book-to-bill ratio
Currently at 1.10, suggesting orders are still running ahead of revenue recognition. This remains an important signal for multi-year growth visibility in defence.
Watch: 1.10 target
Guidance reset risk
Management’s guidance previously came in below market expectations. The market may be sensitive to any further softening in the 2026 outlook.
Watch: guidance commentary
Program concentration
The B-21 Raider and Sentinel carry outsized execution sensitivity. Updates on production ramp and funding may be the clearest drivers of sentiment for the stock.
Watch: B-21 and Sentinel updates
Capacity investment
Higher capital expenditure (capex) supports the industrial base over the longer term, but it may pressure near-term margins. Watch for signs that current investment is weighing on earnings power.
The result comes in above the cited threshold. Management says B-21 Raider production is ahead of schedule, with improving margins. Sentinel program restructuring costs remain below baseline expectations. International awards lift the book-to-bill ratio above 1.15.
Possible reaction: momentum may improve
Base case
EPS between US$6.00 and US$6.20, backlog steady at about US$95.7 billion
The result is broadly in line with the cited range. FCF targets for 2026 are reaffirmed but not expanded. Market focus shifts to organic sales growth metrics and segment operating margins. The initial reaction may depend on the timing of B-21 milestone payments.
The result lands near the low end of the analyst spread. Management flags higher infrastructure costs for Sentinel or delays in restricted space segment awards. Margin pressure in Aeronautics persists, and the 2026 revenue guide narrows towards the US$43.5 billion floor.
Possible reaction: shares may weaken
Reaction trigger to watch: The market response in the first 30 minutes after the result may indicate which scenario traders are leaning towards. A move above the prior session high on volume may support the bull case. A fade back into the range after an initial pop may point to the base case. A break below the prior session low on volume may suggest the bear case is gaining traction.
Sentiment Analysis · Northrop Grumman
Interactive scenario analysis: $NOC
Select earnings outcome
Stealth momentum
B-21 momentum, stronger execution and FCF support
EPS clears US$6.15. Management confirms a production capacity agreement for the B-21 Raider. Sentinel restructuring reaches Milestone B on schedule. Record backlog visibility and higher FCF guidance towards US$3.5 billion may support broader repositioning.
EPS outcome
Above US$6.15
B-21 Signal
Acceleration
FCF guide
$3.5 billionn range
Likely reaction
Momentum rally
Sources & Data Methodology
Sources: Reporting dates and release times are from company investor relations calendars where marked Confirmed; otherwise they are GO Markets estimates. Consensus EPS, revenue and analyst-range data are sourced from Bloomberg and Earnings Whispers, as at 7 April 2026 (AEDT). Company guidance, backlog and operating metrics are sourced from the latest company filings, results presentations or investor relations materials unless stated otherwise. Any scenario analysis reflects GO Markets analysis. Figures and schedules may change without notice.
Bottom line
In a market shaped by geopolitical risk and shifting rate expectations, companies with visible demand and longer-cycle revenue may continue to attract attention. But sentiment can still turn quickly if valuations are stretched, rate expectations shift again, or tensions in the Middle East ease.
That is why the story still needs to be tested against the numbers, not just the narrative. GO Markets will be analysing more companies throughout this earnings season. For more updates, visit our
earnings page,
follow our social media channels, or check the weekly newsletters.
Your next earnings setup starts here
Stay ahead of major beats, misses, and market surprises. Log in to your terminal, open a new account, or explore our dedicated earnings academy.