We are less than three weeks away from the ASX earning season and we are less than two weeks away from the earnings season in the US. So, we need to start prepping for trades and opportunities now. First and foremost, do not forget that confession season is well and truly upon us here in Australia.
Downgrades clearly have been coming from the discretionary sector; we've even seen companies hit the wall with the likes of Booktopia going into administration. There are some clear thematics that are growing in the Australian market. Energy, while the worst performing sector for the financial year 2024, may actually show you that earnings were slightly above expectation on higher than expected oil prices.
Materials led in the main by BHP, Rio and FMG Have once again benefited from higher than expected iron ore prices. It also benefited from a lower than expected AUD/USD where average FX prices were expected to be between $0.68 and $0.73 but instead have averaged between $0.63 and $0.67. What we're looking for is operational costs, overall margins and forward looking guidance, something that these firms have lacked in the last three financial updates.
Watch very closely for the excitement that will come from things like copper at the expense of the issues that are facing nickel lithium and other transition metals that have had really tough periods in FY24. Moving to the banks this is a sector people argue is fully valued. It's not hard to argue when through the financial year CBA made record all time highs several times and is still within a whisker of its record all time high.
Higher interest rates will indeed improve net interest margins. However, the unknown question and what we need to see at its August full year earnings is the impact higher rates are having on bad and doubtful debts, the possible increase in provisioning and more importantly the impact its having on new loans and refinancing. There is an argument to be made that banking is possibly fully priced and no matter what result is delivered won't necessarily create a leg further higher.
Finally, you can't go past consumer staples and discretionary. Retail sales numbers over the last 18 months have actually shown discretionary spending At or above 2022 levels although month on month figures have been erratic. The question that will come for discretionary spending is margins and how much sales revenue translates to the bottom line in earnings and profit.
Staples on the other hand have seen consistent movement on the revenue line but the question will be the margin and after the very targeted senate inquiry into supermarkets any sign profits are above trend may actually be met with concern as geopolitics raises its head. 33 times in 2024 the US 500 and the Tech 100 have made record highs – can it continue? Look into the US and the ending season that it is about to undertake. We have to look at several core thematics that are likely to be raised.
Artificial Intelligence (AI) The question you’ve got to ask is: is the time frame long or short? We raised this Mag 7 stocks etc Microsoft, Amazon, Alphabet, apple have clear potential. They are evolving their business models and see the integration of AI as the future of their individual businesses.
That will likely come up in their numbers but it will come with operational and initial upfront costs as the integration of AI begins. This is all long term may not fully capture short term opportunities which is still presenting very much in the semiconductor providers. NVIDIA and Advanced Micro Devices are taking full advantage and monetizing the compute cycle.
This clearly won't be forever because it will go from semiconductors to infrastructure to software and therefore the flows will move back towards the bigger end of town but overall the AI thematic still flows towards the semiconductors for now and that's likely to be shown in the earnings season that's coming. Data Centres That brings us to data centres because the potential for ensuring AI requires a heck of a lot of storage and a heck of a lot of processing. There are estimates the data centres will need to grow by 420% in Europe and 250% in the US by 2035 based on the rate of growth in AI right now.
Therefore, we need to watch providers like Dell Technologies and Intel which are big providers of data centres currently. We think the market hasn’t fully appreciated DC needs in the AI revolution. Cybersecurity The final key theme in the AI data centre technology space that we also think needs to be watched is cyber security.
It's been something along the lines of a 70% increase in ransomware attacks over the past 24 months. The regulatory requirements and the budgets required to deal with these increased threats is only just beginning. That brings players like Fortinet to the fore IT programmes and it's pensively to develop programs for enterprise makes it an interesting one going forward.
GLP-1 ‘Weight Loss’ Medicines Another theme of being a really strong driver of the S&P 500 is the rise of GLP-1 medicines. The weight loss craze that has come off the back of this Amazon has been incredible. Initially obviously developed for diabetes but having an additional effect of weight loss has created a product out of nowhere.
Eli Lilly and Co is a key player in this space with its GLP one class medicines already approved by the FDA. It's been launched in the US and its oral intake has posted adoption. It is not the only one in this space but shows very clearly the impact weight loss medicines are having on earnings.
The caveat we have though is side effects and long term impacts are still being found and could be said as a capping issue on price. Whatever way you look at it the US dating season however will be incredibly exciting and it is the reason The US markets continue to see huge capital inflows as they are much more exciting in this current environment than traditional value markets such as Australia.
By
Evan Lucas
The information provided is of general nature only and does not take into account your personal objectives, financial situations or needs. Before acting on any information provided, you should consider whether the information is suitable for you and your personal circumstances and if necessary, seek appropriate professional advice. All opinions, conclusions, forecasts or recommendations are reasonably held at the time of compilation but are subject to change without notice. Past performance is not an indication of future performance. Go Markets Pty Ltd, ABN 85 081 864 039, AFSL 254963 is a CFD issuer, and trading carries significant risks and is not suitable for everyone. You do not own or have any interest in the rights to the underlying assets. You should consider the appropriateness by reviewing our TMD, FSG, PDS and other CFD legal documents to ensure you understand the risks before you invest in CFDs.
Jika Anda menghabiskan waktu melihat terminal perdagangan, Anda telah melihatnya. Judul berita pecah, garis grafik terputus, dan tiba-tiba semua orang bergegas menuju pintu keluar yang sama atau pintu masuk yang sama. Sepertinya kekacauan. Dalam praktiknya, seringkali merupakan rantai respons mekanis.
Ini penting karena beberapa alasan. Banyak pembaca menganggap cerita itu adalah perdagangan. Itu tidak. Ceritanya, apakah itu keputusan suku bunga, kejutan pasokan atau kehilangan pendapatan, adalah bahan bakar dan pedoman adalah mesinnya.
Di bawah ini adalah tujuh strategi inti yang sering digunakan dalam perdagangan kontrak untuk perbedaan (CFD). Dengan CFD, Anda tidak membeli aset yang mendasarinya. Anda berspekulasi tentang perubahan nilai. Itu berarti seorang pedagang dapat mengambil posisi panjang jika harga naik, atau posisi pendek jika turun.
Tujuh strategi yang harus dipahami terlebih dahulu
1. Mengikuti tren (permainan pendirian)
Trend follow bekerja pada gagasan bahwa pasar yang sudah bergerak dapat tetap bergerak sampai bertemu dengan hambatan struktural yang jelas. Beberapa pelaku pasar melihatnya sebagai pendekatan berbasis grafik karena berfokus pada arah yang berlaku daripada mencoba menyebut titik balik yang tepat.
Alasannya: Tujuannya adalah untuk mengidentifikasi bias arah yang jelas, seperti tertinggi yang lebih tinggi dan terendah yang lebih tinggi, dan mengikuti momentum itu daripada posisi melawannya.
Apa yang dicari pedagang: Rata-rata pergerakan eksponensial (EMA), seperti EMA 50 hari atau 200 hari, biasanya digunakan untuk menafsirkan kekuatan tren, meskipun indikator dapat menghasilkan sinyal palsu dan tidak dapat diandalkan dengan sendirinya.
Sumber: GO Markets | Contoh pendidikan saja.
Cara kerjanya: EMA 50-periode dapat bertindak sebagai level support dinamis yang naik seiring kenaikan harga. Dalam tren naik, beberapa pedagang mengawasi pasar untuk membuat level tertinggi baru yang lebih tinggi (HH), kemudian menarik kembali ke arah EMA sebelum bergerak lebih tinggi lagi. Setiap level rendah yang lebih tinggi (HL) mungkin menunjukkan pembeli masih memegang kendali.
Ketika harga menyentuh atau mendekati EMA 50-periode selama pullback itu, beberapa pedagang memperlakukan area itu sebagai zona keputusan potensial daripada mengasumsikan tren akan berlanjut secara otomatis.
Apa yang harus ditonton: Urutan HH dan HL adalah bagian dari bukti struktural suatu tren. Jika urutan itu rusak, misalnya jika harga turun di bawah HL sebelumnya, tren mungkin melemah dan pengaturan mungkin tidak lagi bertahan.
2. Range trading (permainan ping-pong)
Pasar dapat menghabiskan waktu lama bergerak ke samping. Itu menciptakan rentang, di mana pembeli dan penjual berada dalam keseimbangan sementara. Perdagangan rentang dibangun di sekitar perilaku ini, dengan fokus pada pergerakan di dekat bagian bawah dan atas kisaran yang ditetapkan.
Alasannya: Harga bergerak antara lantai, yang dikenal sebagai support, dan plafon, yang dikenal sebagai resistensi. Bergerak di dekat batas-batas tersebut dapat membantu menentukan lebar rentang.
Apa yang dicari pedagang: Beberapa pedagang menggunakan osilator seperti Relative Strength Index (RSI) untuk membantu menilai apakah aset terlihat overbuy atau oversold di dekat setiap batas.
Sumber: GO Markets | Contoh pendidikan saja.
Cara kerjanya: Level support adalah zona harga di mana minat beli secara historis cukup kuat untuk menghentikan pasar turun lebih jauh. Level resistensi adalah di mana tekanan jual secara historis mencegah kenaikan lebih lanjut.
Ketika harga mendekati support, beberapa pedagang mencari tanda-tanda potensi rebound. Ketika mendekati resistensi, mereka mencari tanda-tanda bahwa momentum mungkin memudar. Pembacaan RSI di bawah 35 dapat menunjukkan pasar oversold di dekat support, sementara pembacaan di atas 65 dapat menunjukkan bahwa pasar berada di atas pembelian di dekat resistensi.
Apa yang harus ditonton: Risiko utama dalam range trading adalah breakout, ketika harga mendorong secara tegas melalui kedua level dengan momentum yang kuat. Ini mungkin menandakan dimulainya tren baru dan menggunakan stop-loss tepat di luar kisaran pada setiap perdagangan dapat membantu mengelola risiko itu.
3. Breakouts (permainan pegas melingkar)
Akhirnya, setiap rentang berada di bawah tekanan. Terobosan terjadi ketika keseimbangan bergeser dan harga mendorong melalui support atau resistance. Pasar bergantian antara periode volatilitas rendah, di mana harga bergerak menyamping dalam kisaran yang ketat, dan ledakan volatilitas tinggi di mana harga dapat membuat pergerakan arah yang lebih besar.
Alasannya: Konsolidasi yang tenang terkadang dapat diikuti oleh ekspansi volatilitas yang lebih luas. Semakin ketat kompresi, semakin banyak energi yang dapat disimpan untuk langkah berikutnya.
Apa yang dicari pedagang: Bollinger Bands sering digunakan untuk menafsirkan perubahan volatilitas. Saat pita mengencang, tekanan terbentuk. Beberapa pelaku pasar melihat pergerakan di luar band sebagai tanda bahwa kondisi mungkin berubah.
Sumber: GO Markets | Contoh pendidikan saja.
Cara kerjanya: Bollinger Bands terdiri dari garis tengah, rata-rata pergerakan 20 periode, dan 2 pita luar yang berkembang atau berkontraksi berdasarkan volatilitas harga baru-baru ini. Ketika band-band menyempit dan saling berdekatan, tekanan, pasar menjadi sangat tenang.
Ini sering digambarkan sebagai pegas melingkar. Energi mungkin sedang berkembang, dan gerakan yang lebih tajam dapat mengikuti. Beberapa pedagang memperlakukan langkah pertama melalui pita luar sebagai petunjuk awal tentang arah, bukan sinyal definitif tersendiri.
Apa yang harus ditonton: Tidak setiap tekanan menyebabkan terobosan yang kuat. Terobosan palsu terjadi ketika harga bergerak sebentar di luar band, kemudian dengan cepat berbalik kembali ke dalam. Menunggu lilin menutup di luar band, alih-alih memasuki pertengahan lilin, dapat mengurangi risiko terjebak dalam gerakan yang salah.
4. Perdagangan berita (permainan deviasi)
Ini adalah perdagangan yang digerakkan oleh peristiwa. Fokusnya adalah pada kesenjangan antara apa yang diharapkan pasar dan apa yang sebenarnya disampaikan oleh data atau judul. Rilis data ekonomi, seperti angka inflasi (IHK), laporan ketenagakerjaan dan keputusan bank sentral, dapat menyebabkan pergerakan tajam dan cepat di pasar keuangan.
Alasannya: Rilis berdampak tinggi, seperti data inflasi atau keputusan bank sentral, dapat memaksa repricing aset dengan cepat. Semakin besar kejutan relatif terhadap harapan, semakin besar pergerakannya.
Apa yang dicari pedagang: Pedagang sering menggunakan kalender ekonomi untuk melacak waktu. Beberapa fokus pada bagaimana pasar berperilaku setelah reaksi awal, daripada memperlakukan langkah pertama sebagai definitif.
Sumber: GO Markets | Contoh pendidikan saja.
Cara kerjanya: Sebelum berita, harga dapat bergerak dalam kisaran yang tenang dan ketat saat pedagang menunggu. Ketika data dirilis, jika pembacaan aktual berbeda secara signifikan dari ekspektasi konsensus, harga ulang dapat terjadi dengan cepat.
Emas, misalnya, dapat melonjak tajam pada pembacaan CPI yang berada di atas ekspektasi. Namun, lilin juga dapat mencetak sumbu atas yang sangat panjang, yang berarti harga mencapai lonjakan tertinggi tetapi kemudian ditolak dengan kuat. Penjual dapat masuk dengan cepat, dan harga dapat kembali. Pola spike-and-retrace ini adalah salah satu pengaturan yang lebih dikenal dalam perdagangan berita.
Apa yang harus ditonton: Arah dan ukuran lonjakan awal tidak selalu menceritakan kisah lengkapnya. Panjang sumbu dapat menawarkan petunjuk penting. Sumbu panjang mungkin menunjukkan gerakan awal ditolak, sementara sumbu yang lebih pendek setelah rilis data dapat menunjukkan gerakan arah yang lebih berkelanjutan.
5. Pembalikan rata-rata (permainan karet gelang)
Harga terkadang bisa bergerak terlalu jauh, terlalu cepat. Pembalikan rata-rata dibangun di atas gagasan bahwa gerakan yang terlalu panjang dapat melayang kembali ke rata-rata historisnya, seperti karet gelang yang ditarik terlalu kencang, kemudian putus kembali.
Alasannya: Ini adalah pendekatan yang berlawanan. Ini mencari rentang optimisme atau pesimisme yang mungkin tidak berkelanjutan, dan posisi untuk kembali ke keseimbangan.
Apa yang dicari pedagang: Contoh umum adalah harga bergerak jauh dari rata-rata pergerakan 20 hari (MA) sementara RSI juga mencapai pembacaan ekstrem. Dalam pengaturan itu, pedagang memperhatikan pergerakan kembali ke rata-rata daripada kelanjutan menjauh darinya.
Sumber: GO Markets | Contoh pendidikan saja.
Cara kerjanya: MA 20-periode mewakili harga rata-rata pasar baru-baru ini. Ketika harga bergerak ke zona ekstrim, seperti lebih dari 3 standar deviasi di atas atau di bawah rata-rata itu, harga telah bergerak jauh dari tren baru-baru ini.
RSI di atas 70 dapat menunjukkan pasar membentang ke atas, sementara di bawah 30 dapat menunjukkan hal yang sama untuk sisi negatifnya. Beberapa pedagang reversi rata-rata menggunakan sinyal gabungan ini sebagai tanda bahwa kemunduran menuju MA 20-periode mungkin terjadi, daripada mengasumsikan pergerakan akan terus berlanjut.
Apa yang harus ditonton: Strategi reversi rata-rata dapat membawa risiko signifikan di pasar yang sedang tren. Pasar dapat tetap diperpanjang lebih lama dari yang diharapkan, dan posisi yang masuk melawan tren jangka pendek dapat menghasilkan penurunan besar. Ukuran posisi dan stop-loss yang jelas sangat penting.
6. Tingkat psikologis (permainan tokoh besar)
Pasar didorong oleh orang-orang, dan orang cenderung fokus pada angka bulat. US $100, US $2.000 atau paritas 1.000 pada pasangan mata uang dapat bertindak sebagai magnet. Di pasar keuangan, tingkat harga tertentu dapat menarik jumlah aktivitas jual beli yang tidak proporsional, bukan karena analisis teknis saja, tetapi karena psikologi manusia.
Alasannya: Pesanan besar, stop-loss, dan level take-profit dapat mengelilingi angka-angka besar ini, yang dapat memperkuat dukungan atau resistensi. Perilaku yang memperkuat diri ini adalah salah satu alasan penolakan ini bisa menjadi bermakna bagi para pedagang.
Apa yang dicari pedagang: Pedagang sering memperhatikan bagaimana harga berperilaku saat mendekati angka bulat. Pasar mungkin ragu, menolak level atau menerobosnya dengan momentum. Beberapa penolakan sumbu pada tingkat yang sama dapat membawa lebih banyak bobot daripada satu penolakan.
Sumber: GO Markets | Contoh pendidikan saja.
Cara kerjanya: Ketika harga mendekati angka bulat dari bawah, beberapa pedagang memperhatikan sumbu atas yang panjang, garis vertikal tipis di atas badan lilin. Sumbu atas yang panjang berarti harga mencapai level itu, tetapi penjual melangkah masuk secara agresif dan mendorongnya kembali ke bawah sebelum lilin ditutup.
Satu penolakan sumbu mungkin penting. Tiga dalam satu cluster mungkin lebih signifikan. Beberapa pedagang menggunakan penolakan akumulasi ini sebagai bagian dari kasus untuk pengaturan pendek (jual) pada level itu.
Apa yang harus ditonton: Tingkat psikologis juga dapat bertindak sebagai magnet ke arah yang berlawanan. Jika harga menembus dengan keyakinan, level tersebut kemudian dapat bertindak sebagai dukungan. Penutupan yang menentukan di atas level, bukan hanya jeda sumbu, bisa menjadi tanda awal bahwa pengaturan penolakan tidak lagi bertahan.
7. Rotasi sektor (permainan musim ekonomi)
Ini adalah strategi makro. Ketika latar belakang ekonomi berubah, modal dapat berpindah dari sektor yang tumbuh lebih tinggi ke sektor yang lebih defensif, dan kembali lagi. Tidak semua bagian pasar saham bergerak ke arah yang sama pada saat yang bersamaan.
Alasannya: Dalam perekonomian yang melambat, pengeluaran diskresioner dapat melemah sementara permintaan untuk layanan penting dapat tetap lebih stabil. Investor dapat merotasi modal antar sektor sesuai dengan itu.
Apa yang dicari pedagang: Dengan CFD, beberapa pedagang mengekspresikan pandangan ini melalui kekuatan relatif, mengambil eksposur ke sektor yang lebih kuat sambil mengurangi atau mengimbangi eksposur ke sektor yang lebih lemah.
Sumber: GO Markets | Contoh pendidikan saja.
Cara kerjanya: Selama fase pertumbuhan, ketika ekonomi berkembang, investor cenderung lebih memilih sektor yang berorientasi pertumbuhan seperti teknologi. Ketika lingkungan ekonomi bergeser, mungkin karena kenaikan suku bunga, memperlambat pendapatan atau meningkatnya risiko resesi, titik rotasi mungkin muncul.
Pada fase perlambatan, polanya bisa berbalik. Teknologi dapat melemah sementara utilitas dapat menguat, karena investor memindahkan modal ke sektor defensif yang menghasilkan pendapatan. Sinyal awal dapat mencakup kinerja relatif kurang di sektor pertumbuhan dikombinasikan dengan kekuatan yang tidak biasa dalam pertahanan.
Apa yang harus ditonton: Rotasi sektor biasanya bukan peristiwa semalam. Biasanya berlangsung selama berminggu-minggu hingga berbulan-bulan. Melacak rasio antara dua sektor, yang sering ditunjukkan dalam grafik kekuatan relatif, dapat membuat pergeseran ini terlihat sebelum menjadi jelas dalam hal harga absolut.
Mengapa manajemen risiko adalah mesin kelangsungan hidup
Langkah judul adalah satu hal. Implikasi pasar untuk akun Anda adalah hal lain. Jika Anda tidak mengelola mekaniknya, strateginya tidak masalah.
Karena CFD diperdagangkan dengan margin, pergerakan pasar kecil mungkin memiliki dampak besar pada akun. Jika leverage terlalu tinggi, bahkan goyangan kecil dapat memicu margin call atau penutupan posisi otomatis, tergantung pada persyaratan penyedia. Ini bukan risiko teoretis. Ini adalah alasan umum pedagang baru kehilangan lebih dari yang mereka harapkan pada perdagangan yang benar secara arah.
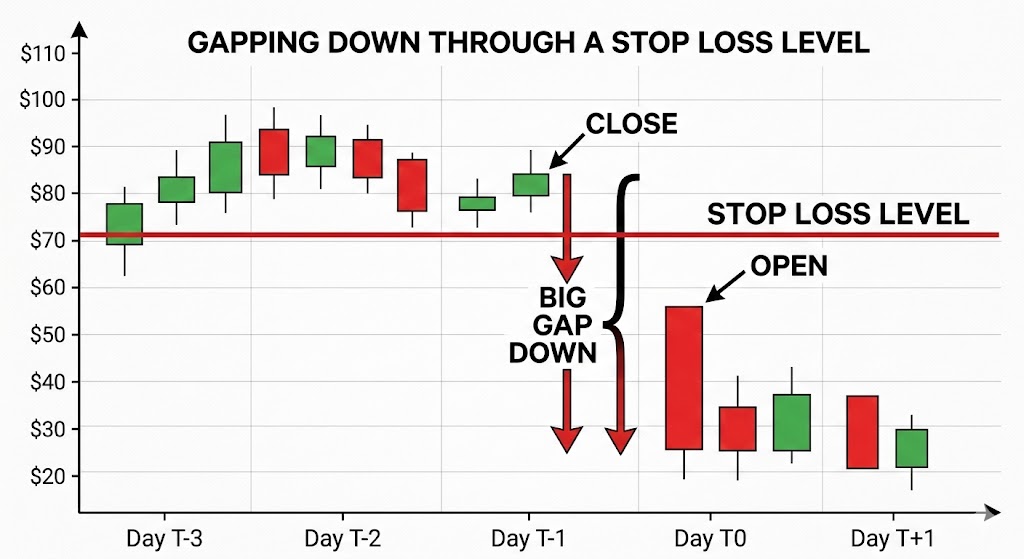
Pasar tidak selalu bergerak dalam garis lurus. Terkadang, kesenjangan harga dari satu level ke level lainnya, terutama setelah akhir pekan atau acara berita besar dan dalam kondisi tersebut, stop-loss mungkin tidak diisi dengan harga yang diminta tepat. Ini dikenal sebagai slippage. Ini adalah salah satu alasan mengapa posisi besar dapat membawa risiko tambahan ke dalam pengumuman besar.
Intinya
Kendaraan ini kuat, tetapi pedoman adalah apa yang membantu Anda tetap berada di jalan.
Perdagangan yang jelas seringkali sudah dihargai. Yang lebih penting adalah memahami kondisi pasar mana yang ada di depan Anda. Apakah itu sedang tren, rentang, pecah atau hanya bereaksi terhadap berita utama?
Pembaca yang menilai produk leverage sering fokus pada ukuran posisi, batas risiko, dan pengungkapan produk sebelum memutuskan apakah produk tersebut sesuai untuk mereka. Berita utama akan terus berubah. Matematika manajemen risiko tidak.
Siap untuk berdagang di luar mata uang utama? Buka akun · Masuk
Penafian: Artikel ini hanya informasi umum dan dimaksudkan untuk tujuan pendidikan. Ini menjelaskan konsep perdagangan umum dan perilaku pasar dan bukan merupakan saran produk keuangan, rekomendasi, atau sinyal perdagangan. Contoh apa pun hanya ilustratif dan tidak memperhitungkan tujuan, situasi keuangan, atau kebutuhan Anda. CFD adalah produk leverage yang kompleks yang membawa tingkat risiko tinggi. Sebelum bertindak, pertimbangkan PDS dan TMD dan apakah perdagangan CFD sesuai untuk Anda. Carilah saran independen jika diperlukan. Kinerja masa lalu bukanlah indikator yang dapat diandalkan untuk hasil masa depan.
Volatilitas memiliki cara untuk muncul tanpa diundang.
Suatu hari ASX melayang diam-diam... dan berikutnya, persyaratan margin naik, stop tidak terisi di tempat yang diharapkan, dan portofolio terbuka dengan celah semalam yang tidak nyaman.
Jika Anda telah mencari jawaban, Anda tidak sendirian. Beberapa pertanyaan yang paling banyak dicari tentang volatilitas di kalangan pedagang Australia berhubungan dengan margin call, slippage, gap semalam, leverage exchange trading funds (ETF), dan alat seperti rata-rata true range (ATR).
Inilah yang terjadi.
Mengapa ini penting sekarang
Pasar global menjadi lebih sensitif terhadap suku bunga, data inflasi, geopolitik, dan arus yang digerakkan oleh teknologi. Ketika likuiditas menipis dan ketidakpastian meningkat, perubahan harga melebar. Itu adalah volatilitas.
Dan volatilitas tidak hanya mempengaruhi arah harga, tetapi juga mengubah cara perdagangan dieksekusi, berapa banyak modal yang dibutuhkan, dan bagaimana risiko berperilaku di bawah permukaan.
Terjemahan: Volatilitas bukan hanya tentang pergerakan yang lebih besar, melainkan tentang pergerakan yang lebih cepat dan likuiditas yang lebih tipis - saat itulah mekanisme perdagangan paling penting.
Mengapa broker saya meningkatkan persyaratan margin?
Salah satu pertanyaan yang paling dicari tentang volatilitas adalah mengapa persyaratan margin meningkat tanpa peringatan.
Ketika pasar menjadi tidak stabil, broker dapat meningkatkan persyaratan margin pada kontrak untuk perbedaan (CFD) dan produk leverage lainnya. Perubahan harga yang lebih besar dapat meningkatkan risiko akun bergerak ke ekuitas negatif sehingga meningkatkan persyaratan margin mengurangi leverage yang tersedia dan dapat membantu mengelola eksposur selama kondisi ekstrem.
Apa artinya ini dalam praktiknya
-Margin call dapat terjadi bahkan jika harga tidak bergerak secara signifikan. Leverage yang efektif dapat turun dengan cepat. Posisi mungkin perlu dikurangi dalam waktu singkat.
Penyesuaian margin biasanya merupakan respons terhadap perubahan risiko pasar, bukan keputusan acak. Di pasar yang sangat fluktuatif, adalah bijaksana untuk mengasumsikan pengaturan margin dapat berubah dengan cepat, oleh karena itu banyak pedagang memilih untuk meninjau ukuran posisi dan buffer yang tersedia mengingat risiko itu.
Apa itu slippage dan mengapa stop saya tidak terisi dengan harga saya?
Topik lain yang sering dicari adalah selip.
Slippage dapat terjadi ketika stop order memicu dan dieksekusi pada harga yang tersedia berikutnya, hasilnya dapat bergantung pada jenis order, likuiditas pasar dan kesenjangan. Di pasar yang tenang, perbedaannya mungkin kecil sedangkan di pasar cepat, harga bisa berada di luar level stop.
Ilustrasi kesenjangan harga melalui level stop-loss | Pasar GO
Pengemudi umum termasuk
-Rilis ekonomi atau pendapatan utama. -Likuiditas tipis. -Tingkat pemberhentian yang penuh sesak. -Sesi semalam.
Order stop-loss umumnya memprioritaskan eksekusi daripada kepastian harga dan selama periode volatilitas tinggi, perbedaan ini menjadi penting. Menyesuaikan ukuran posisi dan menempatkan stop dengan mengacu pada pergerakan harga yang khas mungkin lebih efektif daripada sekadar mengencangkan stop dalam kondisi yang tidak stabil.
Bagaimana cara mengelola gap semalam di ASX?
Australia berdagang sementara Amerika Serikat tidur, dan sebaliknya. Sayangnya, perbedaan zona waktu ini adalah salah satu alasan mengapa risiko celah semalam sering dicari oleh pedagang Australia. Jika pasar AS turun tajam, ASX dapat dibuka lebih rendah keesokan paginya, tanpa peluang untuk keluar antara penutupan dan pembukaan.
Contoh pendekatan manajemen risiko yang dapat digunakan pedagang pasar meliputi
-Indeks lindung nilai menggunakan ASX 200 futures atau CFD*. -Lindung nilai sebagian selama peristiwa berisiko tinggi. -Mengurangi eksposur menjelang pengumuman makro utama.
Lindung nilai dapat mengimbangi bagian dari pergerakan, tetapi memperkenalkan risiko dasar karena saham individu mungkin tidak bergerak sejalan dengan indeks yang lebih luas.
Tidak ada perlindungan yang sempurna, hanya pertukaran antara biaya, kompleksitas, dan pengurangan risiko.
*CFD adalah instrumen yang kompleks dan memiliki risiko tinggi kehilangan uang karena leverage.
Apa risiko utama ETF leverage atau terbalik di pasar yang tidak stabil?
ETF leverage dan invers sering dicari selama periode volatilitas tinggi.
Meskipun produk-produk ini biasanya diatur ulang setiap hari, mereka bertujuan untuk memberikan kelipatan pengembalian harian indeks, bukan pengembalian jangka panjangnya. Di pasar yang bergejolak dan bergejolak, penggabungan harian dapat mengikis nilai bahkan jika indeks berakhir di dekat level awal.
Ini terjadi karena keuntungan dan kerugian bertambah secara asimetris. Penurunan 10 persen membutuhkan keuntungan lebih dari 10 persen untuk pulih. Ketika efek itu dikalikan setiap hari, hasil dapat menyimpang secara material dari indeks yang mendasarinya dari waktu ke waktu.
Instrumen tersebut dapat digunakan secara taktis oleh beberapa pelaku pasar. Mereka umumnya tidak dirancang sebagai alat lindung nilai jangka panjang dan memahami strukturnya sangat penting sebelum menggunakannya dalam strategi.
Bagaimana ATR dapat digunakan untuk menginformasikan penempatan berhenti?
Rata-rata true range (ATR) adalah indikator yang umum digunakan untuk mengukur volatilitas.
ATR memperkirakan berapa banyak aset biasanya bergerak selama periode tertentu, termasuk kesenjangan. Alih-alih menetapkan stop pada persentase sewenang-wenang, beberapa pedagang merujuk ATR dan menempatkan stop pada kelipatan, seperti dua atau tiga kali ATR, untuk mencerminkan kondisi yang berlaku.
Ketika volatilitas meningkat, ATR mengembang dan itu dapat menyiratkan stop yang lebih luas atau ukuran posisi yang lebih kecil jika risiko keseluruhan tetap konstan. Pergeseran adalah dari bertanya, “Seberapa jauh saya bersedia kalah?” untuk bertanya, “Apa langkah normal dalam kondisi saat ini?”
Pertimbangan praktis di pasar yang bergejolak
Selama periode volatilitas tinggi, pedagang dapat mempertimbangkan
Memungkinkan kemungkinan perubahan margin
Mengukur posisi secara konservatif jika volatilitas meningkat
Mengakui bahwa order stop-loss tidak menjamin harga keluar tertentu
Meninjau eksposur menjelang peristiwa ekonomi besar
Memahami mekanisme reset harian ETF leverage
Menggunakan ukuran volatilitas seperti ATR untuk menginformasikan penempatan berhenti
Mempertahankan buffer tunai yang memadai
Volatilitas tidak menghargai prediksi saja. Persiapan dan kesadaran risiko dapat membantu pedagang dalam memahami potensi risiko, tetapi hasilnya tetap tidak dapat diprediksi.
Pasar Australia menghadapi pertimbangan struktural spesifik yang dimapkan ke Pasar Asia dan AS. Risiko gap semalam dipengaruhi oleh jam perdagangan AS dan indeks sumber daya berat seperti ASX dapat merespons dengan cepat pergerakan harga komoditas dan data dari China. Eksposur mata uang, termasuk pergerakan AUD dan dolar AS (USD), dapat menambah lapisan variabilitas lainnya.
Volatilitas tidak seragam di seluruh wilayah. Ini berperilaku berbeda tergantung pada struktur pasar dan kedalaman likuiditas.
Pertanyaan yang sering diajukan tentang volatilitas
Apa yang menyebabkan lonjakan tiba-tiba dalam volatilitas pasar? Keputusan suku bunga, data inflasi, perkembangan geopolitik, kejutan pendapatan dan kendala likuiditas adalah pemicu umum.
Mengapa broker meningkatkan margin selama pasar yang bergejolak? Untuk mengurangi eksposur leverage dan mengelola risiko saat perubahan harga melebar.
Bisakah order stop-loss gagal selama volatilitas? Mereka dapat mengalami slippage jika pasar berada di luar level stop, yang berarti eksekusi dapat terjadi pada harga yang lebih buruk dari yang diharapkan. Di pasar cepat atau tidak likuid, perbedaan ini bisa signifikan.
Apakah ETF leverage cocok untuk lindung nilai jangka panjang? Mereka umumnya terstruktur untuk eksposur jangka pendek karena reset harian. Apakah mereka sesuai tergantung pada tujuan Anda, situasi keuangan, dan toleransi risiko.
Bagaimana volatilitas dapat diukur sebelum melakukan perdagangan? Alat seperti ATR, indikator volatilitas tersirat dan analisis rentang historis dapat membantu mengukur kondisi yang berlaku.
Peringatan risiko: Periode volatilitas tinggi dapat menyebabkan pergerakan harga yang cepat, perubahan margin dan eksekusi pada harga yang berbeda dari yang diharapkan. Alat manajemen risiko seperti stop-loss order dan indikator volatilitas dapat membantu dalam menilai kondisi pasar tetapi tidak dapat menghilangkan risiko kerugian, terutama ketika menggunakan produk leverage.
We are less than three weeks away from the ASX earning season and we are less than two weeks away from the earnings season in the US. So, we need to start prepping for trades and opportunities now. First and foremost, do not forget that confession season is well and truly upon us here in Australia.
Downgrades clearly have been coming from the discretionary sector; we've even seen companies hit the wall with the likes of Booktopia going into administration. There are some clear thematics that are growing in the Australian market. Energy, while the worst performing sector for the financial year 2024, may actually show you that earnings were slightly above expectation on higher than expected oil prices.
Materials led in the main by BHP, Rio and FMG Have once again benefited from higher than expected iron ore prices. It also benefited from a lower than expected AUD/USD where average FX prices were expected to be between $0.68 and $0.73 but instead have averaged between $0.63 and $0.67. What we're looking for is operational costs, overall margins and forward looking guidance, something that these firms have lacked in the last three financial updates.
Watch very closely for the excitement that will come from things like copper at the expense of the issues that are facing nickel lithium and other transition metals that have had really tough periods in FY24. Moving to the banks this is a sector people argue is fully valued. It's not hard to argue when through the financial year CBA made record all time highs several times and is still within a whisker of its record all time high.
Higher interest rates will indeed improve net interest margins. However, the unknown question and what we need to see at its August full year earnings is the impact higher rates are having on bad and doubtful debts, the possible increase in provisioning and more importantly the impact its having on new loans and refinancing. There is an argument to be made that banking is possibly fully priced and no matter what result is delivered won't necessarily create a leg further higher.
Finally, you can't go past consumer staples and discretionary. Retail sales numbers over the last 18 months have actually shown discretionary spending At or above 2022 levels although month on month figures have been erratic. The question that will come for discretionary spending is margins and how much sales revenue translates to the bottom line in earnings and profit.
Staples on the other hand have seen consistent movement on the revenue line but the question will be the margin and after the very targeted senate inquiry into supermarkets any sign profits are above trend may actually be met with concern as geopolitics raises its head. 33 times in 2024 the US 500 and the Tech 100 have made record highs – can it continue? Look into the US and the ending season that it is about to undertake. We have to look at several core thematics that are likely to be raised.
Artificial Intelligence (AI) The question you’ve got to ask is: is the time frame long or short? We raised this Mag 7 stocks etc Microsoft, Amazon, Alphabet, apple have clear potential. They are evolving their business models and see the integration of AI as the future of their individual businesses.
That will likely come up in their numbers but it will come with operational and initial upfront costs as the integration of AI begins. This is all long term may not fully capture short term opportunities which is still presenting very much in the semiconductor providers. NVIDIA and Advanced Micro Devices are taking full advantage and monetizing the compute cycle.
This clearly won't be forever because it will go from semiconductors to infrastructure to software and therefore the flows will move back towards the bigger end of town but overall the AI thematic still flows towards the semiconductors for now and that's likely to be shown in the earnings season that's coming. Data Centres That brings us to data centres because the potential for ensuring AI requires a heck of a lot of storage and a heck of a lot of processing. There are estimates the data centres will need to grow by 420% in Europe and 250% in the US by 2035 based on the rate of growth in AI right now.
Therefore, we need to watch providers like Dell Technologies and Intel which are big providers of data centres currently. We think the market hasn’t fully appreciated DC needs in the AI revolution. Cybersecurity The final key theme in the AI data centre technology space that we also think needs to be watched is cyber security.
It's been something along the lines of a 70% increase in ransomware attacks over the past 24 months. The regulatory requirements and the budgets required to deal with these increased threats is only just beginning. That brings players like Fortinet to the fore IT programmes and it's pensively to develop programs for enterprise makes it an interesting one going forward.
GLP-1 ‘Weight Loss’ Medicines Another theme of being a really strong driver of the S&P 500 is the rise of GLP-1 medicines. The weight loss craze that has come off the back of this Amazon has been incredible. Initially obviously developed for diabetes but having an additional effect of weight loss has created a product out of nowhere.
Eli Lilly and Co is a key player in this space with its GLP one class medicines already approved by the FDA. It's been launched in the US and its oral intake has posted adoption. It is not the only one in this space but shows very clearly the impact weight loss medicines are having on earnings.
The caveat we have though is side effects and long term impacts are still being found and could be said as a capping issue on price. Whatever way you look at it the US dating season however will be incredibly exciting and it is the reason The US markets continue to see huge capital inflows as they are much more exciting in this current environment than traditional value markets such as Australia.
Pengumuman gencatan senjata 8 April dan diskusi paralel seputar gencatan senjata 45 hari belum menyelesaikan gangguan Selat Hormuz. Mereka, untuk saat ini, membatasi skenario terburuk, tetapi lalu lintas tanker tetap pada sebagian kecil dari tingkat normal dan permintaan Iran untuk biaya transit menandakan perubahan struktural, bukan yang sementara.
Apa yang dimulai sebagai konflik regional telah menjadi kejutan energi global, dan pertanyaan bagi pasar bukan lagi apakah Hormuz terganggu, tetapi seberapa permanen gangguan itu mengubah dasar harga untuk minyak.
Kuncinya yang menarik
Sekitar 20 juta barel per hari (bpd) minyak dan produk minyak bumi biasanya melewati Selat Hormuz antara Iran dan Oman, setara dengan sekitar seperlima dari konsumsi minyak global dan sekitar 30% dari perdagangan minyak laut global.
Ini adalah kejutan aliran, bukan masalah inventaris. Pasar minyak bergantung pada throughput berkelanjutan, bukan penyimpanan statis.
Jika gangguan berlanjut lebih dari beberapa minggu, Brent dapat bergeser dari lonjakan jangka pendek ke guncangan harga yang lebih luas, dengan risiko stagflasi.
Lalu lintas kapal tanker melalui selat turun dari sekitar 135 kapal per hari menjadi kurang dari 15 kapal pada puncak gangguan, pengurangan sekitar 85%, dengan lebih dari 150 kapal berlabuh, dialihkan, atau tertunda.
Gencatan senjata dua minggu diumumkan pada 8 April, dengan negosiasi gencatan senjata selama 45 hari sedang berlangsung. Iran secara terpisah telah mengisyaratkan permintaan biaya transit pada kapal-kapal yang menggunakan selat, yang, jika diformalkan, akan mewakili dasar geopolitik permanen pada biaya energi.
Pasar telah mulai berputar menjauh dari pertumbuhan dan eksposur teknologi terhadap nama energi dan pertahanan, mencerminkan pandangan bahwa kenaikan minyak menjadi biaya struktural daripada premi risiko sementara.
Institutional Grade Performance
Master the Markets with MetaTrader 5
Trade hundreds of instruments with superior speed and advanced technical analysis. Harness full EA functionality to execute your strategy.
Selat Hormuz menangani sekitar 20 juta barel per hari minyak dan produk minyak bumi, setara dengan sekitar 20% dari konsumsi minyak global dan sekitar 30% dari perdagangan minyak laut global. Dengan permintaan minyak global mendekati 104 juta barel per hari dan kapasitas cadangan terbatas, pasar sudah seimbang sebelum eskalasi terbaru.
Selat ini juga merupakan koridor penting untuk gas alam cair. Sekitar 290 juta meter kubik LNG transit setiap hari rata-rata pada tahun 2024, mewakili sekitar 20% dari perdagangan LNG global, dengan pasar Asia sebagai tujuan utama.
Badan Energi Internasional (IEA) telah menggambarkan Hormuz sebagai titik henti transit minyak yang paling penting di dunia, mencatat bahwa bahkan gangguan sebagian dapat memicu pergerakan harga yang terlalu besar. Minyak mentah Brent telah bergerak di atas US $100 per barel, mencerminkan keketatan fisik dan kenaikan premi risiko geopolitik.
Sumber: Administrasi Informasi Energi AS, tanggal 17 Juni 2025, menggunakan rata-rata harian 2024
Kapal tanker menganggur karena aliran lambat
Data pengiriman dan asuransi sekarang menunjukkan ketegangan secara real time. Lebih dari 85 kapal induk minyak mentah besar dilaporkan terdampar di Teluk Persia, sementara lebih dari 150 kapal telah berlabuh, dialihkan atau ditunda karena operator menilai kembali keselamatan dan asuransi. Itu akan meninggalkan sekitar 120 juta hingga 150 juta barel minyak mentah menganggur di laut.
Volume tersebut hanya mewakili enam hingga tujuh hari throughput Hormuz normal, atau sedikit lebih dari satu hari konsumsi minyak global.
Data pengiriman dan asuransi yang diperbarui sekarang mengkonfirmasi lebih dari 150 kapal telah berlabuh, dialihkan, atau tertunda, naik dari 85 yang awalnya dilaporkan. Cakupan konsumsi global 1,3 hari dari minyak mentah yang tidak digunakan tetap menjadi kendala yang mengikat: ini adalah kejutan aliran, bukan masalah penyimpanan, dan gencatan senjata belum diterjemahkan ke dalam throughput yang dipulihkan secara bermakna.
🌋 Trump, volatility and Hormuz.
As tariff shocks collide with a ten year extreme in oil positioning, the margin for error is zero. See the technical markers and safe haven pivots defining the current risk environment.
Pasar yang dibangun di atas aliran, bukan penyimpanan
Pasar minyak berfungsi pada pergerakan terus menerus. Kilang, pabrik petrokimia, dan rantai pasokan global dikalibrasi untuk pengiriman yang stabil di sepanjang jalur laut yang dapat diprediksi. Ketika aliran melalui titik henti yang membawa sekitar seperlima dari konsumsi minyak global dan sekitar 30% dari perdagangan minyak laut global terganggu, sistem dapat bergerak dari keseimbangan ke defisit dalam beberapa hari.
Kapasitas produksi cadangan, sebagian besar terkonsentrasi di OPEC, diperkirakan hanya 3 juta hingga 5 juta barel per hari. Itu jauh di bawah volume yang berisiko jika aliran Hormuz sangat terganggu.
GO Markets — Idle Tankers: Days of Cover
Oil market analysis
How long do idle tankers last?
135M idle barrels — days of cover against each demand benchmark
vs. Strait of Hormuz daily flow (20M bbl/day)
6.75 daysof Hormuz throughput covered
6.75 days
0
5
10
15
20
25
30 days
vs. Global oil consumption (104M bbl/day)
1.3 daysof world demand covered
1.3 days
0
5
10
15
20
25
30 days
vs. US Strategic Petroleum Reserve release (1M bbl/day)
135 daysof full SPR release pace covered
135 days — but SPR exists to replace this role
0
5
10
15
20
25
30 days
135M
idle barrels on tankers (midpoint of 120–150M range)
~33%
of daily Hormuz flow that is idle storage, not transit
<31 hrs
is all idle storage against global daily consumption
Indicative market trajectories based on disruption severity
Scenarios for the weeks ahead
1–2 WEEKS
Ceasefire catch-up
Markets face catch-up repricing. Brent could consolidate in the US$105–US$115 range as risk premia unwind. Brent may trade lower (US$95–US$110) if strategic stocks bridge the temporary shortfall.
2–4 WEEKS
Infrastructure blitz
Shifts to structural supply shock. Brent moving toward US$150–US$200 cannot be ruled out. This is the stagflation trigger where energy costs constrain central bank flexibility.
STRUCTURAL
Geopolitical floor
Iran's transit fee demand creates a permanent input cost. The pre-crisis price structure (US$60–US$70) may not return, embedded in insurance and freight rates.
Critical Threshold
US$120 remains the level at which energy inflation becomes a direct Federal Reserve policy problem.
Risiko inflasi dan limpahan makro
Dampak inflasi dari kejutan minyak biasanya datang dalam gelombang. Harga bahan bakar dan energi yang lebih tinggi dapat mengangkat inflasi utama dengan cepat karena biaya bensin, solar, dan listrik bergerak lebih tinggi.
Seiring waktu, biaya energi yang lebih tinggi dapat melewati pengiriman, makanan, manufaktur, dan layanan. Jika gangguan berlanjut, kombinasi peningkatan inflasi dan pertumbuhan yang lebih lambat dapat meningkatkan risiko lingkungan stagflasi dan membuat bank sentral menghadapi pertukaran yang sulit.
🛢️ Brent hits $100.
Exxon and SLB are leading the rotation out of tech. Get the price targets and technical support levels for the top 5 energy majors.
Tidak ada offset yang mudah, sistem dengan sedikit kelonggaran
Apa yang membuat episode saat ini sangat akut adalah kurangnya kelonggaran dalam sistem global.
Pasokan dan permintaan global mendekati 103 juta hingga 104 juta barel per hari meninggalkan sedikit bantalan cadangan ketika chokepoint penanganan hampir 20 juta barel per hari, atau sekitar seperlima dari konsumsi minyak global, terganggu. Diperkirakan kapasitas cadangan 3 juta hingga 5 juta barel per hari, sebagian besar di dalam OPEC, hanya akan mencakup sebagian kecil dari volume yang berisiko.
Rute alternatif, termasuk jaringan pipa yang melewati Hormuz dan mengalihkan rute pengiriman, hanya dapat mengimbangi sebagian arus yang hilang, dan biasanya dengan biaya yang lebih tinggi dan dengan waktu tunggu yang lebih lama.
Intinya
Sampai transit melalui Selat Hormuz dipulihkan dan dipandang aman secara kredibel, aliran minyak global kemungkinan akan tetap terganggu dan premi risiko meningkat. Bagi investor, pembuat kebijakan dan pembuat keputusan perusahaan, pertanyaan intinya adalah apakah minyak dapat bergerak ke tempat yang seharusnya, setiap hari, tanpa gangguan.
Market Opportunity
Don't just watch the squeeze. Trade the framework.
As positioning gaps hit decade extremes, access advanced charting tools and real time execution on the six key markets defining this cycle.
Sebuah berita utama tentang peradaban yang “sekarat malam ini” dibangun untuk membanjiri, tetapi sinyal yang lebih jelas mungkin adalah ketenangan di bawahnya, karena pasar mulai memperlakukan siklus eskalasi tajam ini diikuti oleh de-eskalasi mendadak sebagai pola, bukan kejutan.
Dalam lingkaran makro, pola itu memiliki label tumpul: TACO, atau “Trump Always Chickens Out”. Frasa dimuat, tetapi logikanya sederhana. Ancaman tekanan maksimum melanda, aset berisiko goyah, kemudian jeda, penundaan atau hasil yang lebih lembut muncul begitu biaya ekonomi mulai menggigit.
Itu tidak berarti risikonya kecil. Ini mungkin hanya berarti investor telah terbiasa dengan naskah di mana retorika berkobar, pasar menyerap guncangan, dan pengekangan muncul sebelum skenario terburuk sepenuhnya muncul.
Developing situation
|
Strait of Hormuz | Section 122 Tariffs
PublishedApril 2026
Brent CrudeAbove US$100
VIX31
In focus6 markets
Oil PositioningDecade-low longs
The Framework & MechanismIs the market the red line?
+
This is where the TACO idea starts to matter. Traders are not just watching the rhetoric. They are watching when it starts to hit markets, inflation and the wider economy.
Oil is at the centre of that risk. If disruption around the Strait of Hormuz starts to threaten global energy flows, the story quickly becomes macro. Higher oil can lift inflation expectations, pressure central banks and tighten financial conditions.
That is why a pause can look less like diplomacy and more like pressure relief. The real red line may be the point where the economic damage becomes too obvious to ignore.
Short Squeezed
Positioning adds another layer. Oil still looks under-owned, with futures positioning near decade-long bearish extremes. If a fresh shock lands, short-covering could drive prices higher much faster than fundamentals alone would suggest.
That is the short-squeeze risk. In the Commitment of Traders (COT) report, recent data suggests oil long exposure is relatively low by historical standards.
Humanitarian Reality
Whatever may be promised in political messaging, any sustained conflict in Iran would carry a heavy cost in displacement, infrastructure damage and wider regional stress. A relief rally in markets does not change that.
Global Isolation
Even if pauses are used to steady domestic market sentiment, allies and multilateral institutions may view bluff-and-retreat tactics as a credibility problem that creates longer-term diplomatic friction.
Positioning gap indicator
Divergence analysis between positioning and risk environment
APRIL 2026
Bars show GO Markets’ internal estimate of the divergence between current futures positioning and levels seen in comparable historical shock environments.
Brent crudeExtreme
Gold (XAU/USD)Very high
Nasdaq 100High
USD/CNHHigh
US 10 yr yieldMedium
USD/CADMedium
Extreme decade scale positioning extreme
High significant divergence
Medium moderate divergence
Methodology note
The Positioning Gap Indicator is based on GO Markets’ internal analysis and is intended as a high-level, illustrative framework only. It uses a combination of market positioning data, historical comparisons and discretionary assumptions about how similar energy and trade shocks have affected markets in the past. The ‘Extreme’, ‘Very High’, ‘High’ and ‘Medium’ labels are relative internal classifications, not objective market standards, and should not be relied on as predictions, forecasts or a guarantee of future outcomes.
The Six Markets
The six markets that matter most
Each of these six markets is exposed to the current situation through a different mechanism. Understanding the mechanism, not just the price, matters. It helps explain whether a move is a headline reaction or the start of something broader. Tap any card to expand the full analysis.
01
BRENT
Brent crude oil
ENERGYDIRECT CHANNELSQUEEZE RISK: EXTREME
+
The Clear Transmission Channel
Brent is the international benchmark for crude and the most direct transmission mechanism in this geopolitical thesis. Any disruption to physical flows, particularly through the Strait of Hormuz, forces an immediate tightening of global energy supply.
The Positioning Backdrop
Futures positioning currently sits at a ten year bearish extreme. Leveraged funds have cut long exposure heavily. In the event of a physical supply shock, this imbalance creates the potential for a violent short covering squeeze.
● Bull Case
Hormuz disruption extends beyond four weeks. Extended disruption could lift Brent sharply if supply flows are impaired for longer.
● Bear Case
Diplomatic intervention reopens the strait quickly. Strategic petroleum reserve (SPR) releases and increased spare capacity cap any price rally.
Strategic Marker
US$120: the point at which energy inflation becomes a direct Federal Reserve policy problem, rather than just a market narrative.
02
XAU/USD
Gold
SAFE HAVENUNDER-OWNEDSQUEEZE RISK: VERY HIGH
+
The Counter-Intuitive Setup
Despite a clear geopolitical risk profile, leveraged funds have been reducing bullish gold exposure. This leaves the market under-owned at the exact moment the fundamental case for safe haven assets is strengthening.
The Inflation Variable
The critical factor for Gold is whether energy-driven inflation limits the Fed's room to maneuver. If policy flexibility weakens, Gold could catch up quickly as a hedge against stagflation.
● Bull Case
Real yields fall as energy inflation outpaces rate hikes. Under-owned positioning amplifies the catch up move as institutional funds rebuild exposure.
● Bear Case
Geopolitical tensions ease rapidly. The Fed remains credibly focused on inflation, keeping real yields positive and supporting the USD over Gold.
Strategic Marker
One level to monitor is prior resistance, alongside any change in COT positioning.
03
US100/NAS100
Nasdaq 100
TECHNOLOGYDUAL PRESSURERATE AND SUPPLY RISK
+
Why it is a complicated position
The Nasdaq faces immediate pressure from two fronts: Stickier energy-driven inflation forces rates higher for longer, compressing multiples, while trade tensions unsettle the supply chains beneath major tech names.
Why the 10 year yield matters here
When the 10 year Treasury yield holds above 4.5%, the future value of technology earnings must be discounted at a higher rate. AI linked earnings momentum must overpower this valuation headwind.
● Bull Case
Earnings season delivers proof of AI investment generating real revenue. Index components successfully insulate supply chains, and AI capex momentum overrides the macro headwind.
● Bear Case
Energy inflation keeps yields above 4.5%. Multiple compression in high valuation names triggers a broader index decline amid disappointments in AI monetization.
Strategic Marker
S&P 500 at 6,498: a widely watched Fibonacci cluster. A sustained move below this threshold highlights a historically challenging framework for growth equities.
04
USD/CNH
US dollar/offshore Chinese yuan
FXBEIJING READPOLICY PROXY
+
What it tells you
USD/CNH is the cleanest real time read on how Beijing is responding to tariff pressure. A sharp rise suggests China is allowing currency weakness to absorb the costs of trade friction.
Why it matters beyond China
A move in USD/CNH doesn't stay contained. It spills into Asian equities, commodity demand, and broader risk appetite. Deliberate depreciation signals a shift in the global trade environment.
● USD Bull / Yuan Bear
Beijing allows yuan weakness as a deliberate countermeasure. Capital outflows accelerate, and USD safe haven demand reinforces the move.
● Yuan Recovery
Trade negotiations begin and a face saving off ramp is found. PBOC intervention defends the yuan, and the dollar's safe haven premium fades.
Strategic Marker
7.30 on USD/CNH: a sustained move above this has historically been associated with broader risk off moves in Asian markets.
05
US10Y/TNOTE
US 10 year Treasury yield
RATESMACRO PLUMBINGSHAPES EVERYTHING ELSE
+
Why it sits under everything
The 10 year yield shapes mortgage costs, corporate borrowing, and the valuation framework for risk assets globally. When it rises, borrowing becomes more expensive across the entire system.
The Independent Movement Risk
If oil forces the Fed to delay cuts, the 10 year yield could rise regardless of Fed communication. It can tighten financial conditions even before a formal policy shift occurs.
● Rates Fall Case
Oil shock proves transient. Fed maintains guidance and 10 year yields pull back toward 4.0%, relieving pressure on equities and providing support for bonds.
● Rates Rise Case
Sustained oil above US$100 pushes inflation higher. Fed pauses rate cut language and the 10 year yield breaks above 4.5%, compressing equity multiples.
Strategic Marker
4.5% on the 10 year yield: a sustained break above this while oil remains above US$100 is a historically challenging combination for equities.
06
USD/CAD
US dollar/offshore Canadian dollar
FXOIL-LINKEDLEAD INDICATOR
+
The Double Exposure
USD/CAD is a lead indicator because Canada sits at the intersection of energy and trade. It benefits from higher oil revenue but is highly sensitive to US economic and trade conditions.
When the Forces Collide
When oil rises, the CAD often strengthens; when trade stress rises, it weakens. In the current environment, these forces are colliding rather than canceling each other out.
● CAD Strengthens
Oil sustained above US$100 boosts export revenue while trade tensions stay short of Canada specific tariffs. Bank of Canada holds rates steady.
● CAD Weakens
Safe haven USD demand outweighs the oil benefit. Bank of Canada cuts rates to offset trade headwinds.
Strategic Marker
1.42 on USD/CAD: a sustained move above this signals trade anxiety is dominating the oil benefit, often preceding broader risk off moves.
What could go wrong
Four reasons the market logic could fail
+
A coherent macro case is still only a case. Markets regularly ignore tidy narratives for longer than expected, or invalidate them quickly. Four failure paths stand out.
1
The situation de-escalates faster than the news cycle suggests
Geopolitical risk premia can build slowly and disappear quickly. Any credible sign of de-escalation, especially around shipping lanes or energy infrastructure, could reverse oil sharply and drain urgency from the rest of the thesis. This is precisely the scenario the TACO framework predicts.
2
Tariff posturing does not become tariff policy
The market may be reacting to opening positions rather than settled policy. If Washington and Beijing find a face-saving off-ramp, as they have in previous trade disputes, currency and equity moves that anticipated escalation could unwind just as fast as they built.
3
AI investment spending overrides the macro headwind
Technology capital expenditure has remained more resilient than expected for much of the past two years. If earnings season shows that AI infrastructure spending is still translating into real demand and returns, the growth narrative may reassert itself, particularly in the Nasdaq 100.
4
The squeeze never arrives: extended positioning holds for longer than expected
Stretched positioning does not automatically produce a violent reprice. Markets can stay under-owned for months if risk appetite remains weak and institutions are unwilling to rebuild exposure. The set-up can exist without the catalyst arriving in a way that forces the move.
Forward Calendar
What to watch and when
+
Three time horizons matter here. The first tests supply resilience. The second tests financial system health. The third tests whether any shift in market leadership is cyclical or structural.
Three horizon watchlist
Signals and catalysts across the next two months
Next Two Weeks
Chipmaker guidance and supply commentary
Major semiconductor earnings calls will offer an early read on whether supply bottlenecks are worsening and whether management teams are changing production assumptions. If supply commentary deteriorates, the inflation story gets another push and the case for higher for longer rates strengthens.
Next 30 Days
Bank earnings and loan demand
Major US banks will provide a useful check on whether capital spending related to AI infrastructure is still being financed. The most important signal may not be earnings per share. It may be commercial loan demand. If businesses are pulling back on borrowing, the growth cycle may be softening earlier than the market expects.
Next 60 Days
Enablers versus spenders
The more structural test is whether the market begins rewarding businesses that produce physical outputs: energy producers, hardware makers and defence contractors, while penalising software companies that still cannot prove a clear return on AI spending. A wider performance gap between those groups would suggest something deeper than a temporary rotation.
Jalan di depan
Konvergensi ketegangan geopolitik dan posisi ekstrem historis saat ini telah menciptakan lingkungan “mata air melingkar” yang unik untuk pasar global. Sementara TACO kerangka kerja menunjukkan pola eskalasi tajam diikuti oleh jeda strategis, ujian nyata bagi pedagang selama 60 hari ke depan adalah transisi dari volatilitas yang digerakkan oleh headline ke rotasi pasar struktural.
Apakah celah posisi ditutup melalui de-eskalasi lembut atau tekanan pendek yang keras, memiliki kerangka reaksi yang ditentukan dapat membantu pedagang menavigasi kebisingan.
Market Opportunity
Don't just watch the squeeze. Trade the framework.
As positioning gaps hit decade extremes, access advanced charting tools and real time execution on the six key markets defining this cycle.
Jadi inilah masalahnya: musim pendapatan AS April tiba di pasar yang masih terasa sama sekali tidak normal. Seperti yang dijelaskan GO Markets di Buku pedoman pendapatan AS global: Panduan penting untuk pedagang, periode pelaporan ini mendarat setelah perubahan nyata dalam apa yang dipedulikan pasar. Ini bukan lagi hanya tentang mengejar pertumbuhan dengan biaya berapa pun. Ini tentang apa yang dikatakan angka-angka di bawah permukaan.
Dan pada tahun 2026, sinyal-sinyal itu bertabrakan dengan latar belakang gesekan tinggi:
Konflik geopolitik: Ketegangan yang sedang berlangsung di Timur Tengah
Kejutan pasokan minyak: Minyak mentah Brent di atas US $100
The Fed: Bank Sentral Masih Terkena Inflasi
Pivot daya tahan
Ya, AI masih menjadi cerita utama pasar tetapi masih mesin mencolok yang mendapatkan sebagian besar perhatian. Tapi di bawahnya, ada langkah yang lebih tenang menuju perusahaan yang terlihat dibangun untuk bertahan lebih baik ketika kondisinya semakin sulit.
Ketika tarif tidak pasti dan pasar energi berada di bawah tekanan, nama-nama seperti JPMorgan Chase dan kontraktor pertahanan utama mulai membawa lebih banyak bobot. Mereka tidak menggantikan narasi AI, melainkan, mereka menjadi bagian dari cara pedagang membaca selera risiko, daya tahan pendapatan dan, pada akhirnya, di mana pasar mencari sesuatu yang lebih solid untuk dipertahankan.
!
Important: Reporting schedules can change without notice. Reporting dates and release times are from company investor relations calendars where marked Confirmed; otherwise they are GO Markets estimates. Consensus EPS, revenue and analyst-range data are from third-party market consensus sources, as of 7 April 2026 (AEDT). Company guidance, backlog and operating metrics are from the latest company filings or results presentations unless stated otherwise. Figures and schedules may change without notice.
$JPM| Q1 2026 REPORTING PERIOD
JPMorgan Chase & Co.
NYSE | Financial Services | 14 Apr 2026
Confirmed
Global Release Countdown (BMO)
00:00:00:00
Consensus EPS
US$5.42
Consensus Revenue
US$47.88bn
AU/ASIA14 Apr | 8:45 pm
US/LATAM14 Apr | 6:45 am
Market Intelligence: $JPM
Analysis: JPM price drivers and scenarios
NII guidance
~US$103 billion
Full year | US$95 billionn ex:markets
ROTCE target
17%
Possible return on tangible common equity
Analyst range
US$5.02-5.70
Low to high estimate spread
AVG
LOW US$5.02AVG US$5.39HIGH US$5.70
The analyst spread of US$0.68 signals genuine disagreement about how the rate environment is flowing through to margins. A result above consensus but below the high end estimate may produce a muted reaction. A result above US$5.70 may shift the discussion.
Key swing factors for the result
Net interest income (NII)
The clearest macro lever. It reflects the gap between lending rates and deposit costs.
Guidance: US$103 billion for the full year
Return on tangible common equity (ROTCE)
A scale check. It indicates whether JPM is converting scale into efficiency. 17% is the benchmark.
Target: 17% ROTCE
Trading and investment banking
Strong Q1 growth was expected in fees and markets revenue. These lines can offset softness in lending, and stronger-than-expected performance here may shift the narrative away from rate sensitivity.
Watch: investment banking (IB) fees versus the prior quarter
Expense discipline
A bank can beat the EPS estimate and still sell off if expense growth is running too hot. Pairing the EPS result with the expense trajectory gives a fuller read on whether the beat is durable.
Watch: Expense outlook commentary
Trade Execution: $JPM
Earnings reaction framework: Q1 2026
Bull case
EPS above US$5.70, NII on track | ROTCE at or above 17%
The result comes in above the top of the analyst range. NII guidance holds or is revised higher. IB fees and markets revenue show strong Q1 growth. Expense commentary is constructive.
Possible reaction: momentum and repositioning
Base case
EPS between US$5.39 and US$5.70, NII in line | ROTCE near target
The result beats consensus but stays within the expected range. NII tracks guidance. The tone of the conference call may matter more than the headline number. The first move may fade if guidance is unchanged.
Possible reaction: muted or mixed initial response
Bear case
EPS below US$5.39 | NII misses | Expense growth surprises
The result comes in at or below the consensus midpoint. NII guidance is cut or qualified. Expense growth comes in above market expectations. IB or markets revenue disappoints.
Possible reaction: earnings multiple repricing
Reaction trigger to watch: The market response in the first 30 minutes after the result may indicate which scenario traders are leaning towards. A move above the prior session high on volume may support the bull case. A fade back into the range after an initial pop may point to the base case. A break below the prior session low on volume may suggest the bear case is gaining traction.
Sentiment Analysis · JPMorgan Chase
Interactive scenario analysis: $JPM
Select earnings outcome
Growth momentum
AI-linked offset, beat supported by NII and ROTCE
Stronger-than-expected demand for AI-related industrial lending may offset softer mortgage activity. Management maintains guidance as NII remains resilient in higher-for-longer conditions. IB fees and markets revenue may provide additional support. ROTCE at or above 17% would suggest the bank is converting scale into earnings efficiently.
EPS Outcome
Above US$5.70
NII Signal
On track
ROTCE
At or above 17%
Likely Reaction
Momentum may build
Sources & Data Methodology
Sources: Reporting dates and release times are from company investor relations calendars where marked Confirmed; otherwise they are GO Markets estimates. Consensus EPS, revenue and analyst-range data are sourced from Bloomberg and Earnings Whispers, as at 7 April 2026 (AEDT). Company guidance, backlog and operating metrics are sourced from the latest company filings, results presentations or investor relations materials unless stated otherwise. Any scenario analysis reflects GO Markets analysis. Figures and schedules may change without notice.
From credit to defence
If JPMorgan gives the market an early read on the consumer, credit quality and business activity, the defence names may be telling a different story. This is the point where the focus may start to shift from the credit cycle to government-backed demand.
In a market still shaped by geopolitical risk, that matters. Long-dated programs can help support revenue visibility, even when the broader outlook looks less certain. That is one reason the sector remains on the watchlist.
$LMT| Q1 2026 REPORTING PERIOD
Lockheed Martin Corp.
NYSE | Aerospace | Defense | 22 Apr 2026
Estimated
Global Release Countdown (BMO)
00:00:00:00
Consensus EPS
US$6.50
Consensus Revenue
US$16.32bn
AU | ASIA22 Apr | 9:20 pm
US | LATAM22 Apr | 7:20 am
Market Intelligence: $LMT
Analysis: LMT price drivers and scenarios
Order backlog
US$194 billionn
Record visibility
Book-to-bill
1.2x
Orders outpacing sales
Analyst range
US$6.90-7.10
Low to high estimate spread
AVG
LOW ~US$6.90AVG ~US$6.94HIGH US$7.10+
The consensus sits near the lower end of the analyst range. That positioning may leave room for upside if backlog growth and F-35 delivery timelines support execution. A print near the high end, above US$7.10, may extend the move, although the reaction would still depend on guidance and margins.
Key swing factors for the result
Backlog visibility
Primary evidence of demand. Book-to-bill above 1.2x would support full-year guidance and the production ramp.
Backlog: US$194 billion record
Free cash flow (FCF)
Defence stocks are often assessed on cash conversion. The market may look for confirmation of the US$6.5 billion floor.
Guide: US$6.5 billion - $6.8 billion
Missile segment growth
PrSM and THAAD deliveries remain key watchpoints. Strong space margins may help offset softness in aeronautics.
Watch: Fire Control margins
Margin pressure
Pension charges and production inflation remain risks. An earnings beat may fade if operating margins contract.
The result clears the upper half of the analyst range. Management reaffirms or raises the full-year FCF outlook. Strong Missiles and Fire Control (MFC) margins help offset any aeronautics supply chain lag.
Possible reaction: momentum may build and positioning may improve
Base case
EPS between US$6.30 and US$6.70 | Backlog steady at about US$194 billion
The result aligns with the US$6.38 consensus. F-35 delivery pace remains on track but offers no meaningful upside surprise. The market may wait for more specific segment guidance on the conference call.
Possible reaction: muted or mixed initial response
The result falls towards the bottom of the analyst spread. Management cites further software delays or program losses. The FCF trajectory narrows towards the lower end of previous expectations.
Possible reaction: the share price may come under pressure
Reaction trigger to watch: The market response in the first 30 minutes after the result may indicate which scenario traders are leaning towards. A move above the prior session high on volume may support the bull case. A fade back into the range after an initial pop may point to the base case. A break below the prior session low on volume may suggest the bear case is gaining traction.
Sentiment Analysis · Lockheed Martin
Interactive scenario analysis: $LMT
Select earnings outcome
Backlog confirmed
Backlog and FCF confirmation may support continuation
EPS clears the top of the analyst range. Backlog holds at or above US$194 billion and book-to-bill stays above 1.2, which would suggest orders are replenishing faster than revenue is being recognised. FCF guidance holds within the stated range.
EPS outcome
Above US$7.00
Backlog signal
Above US$194 billion
FCF guide
Holds or improves
Likely reaction
Continuation may follow
Sources & Data Methodology
Sources: Reporting dates and release times are from company investor relations calendars where marked Confirmed; otherwise they are GO Markets estimates. Consensus EPS, revenue and analyst-range data are sourced from Bloomberg and Earnings Whispers, as at 7 April 2026 (AEDT). Company guidance, backlog and operating metrics are sourced from the latest company filings, results presentations or investor relations materials unless stated otherwise. Any scenario analysis reflects GO Markets analysis. Figures and schedules may change without notice.
Not all defence names are the same
Lockheed Martin and Northrop Grumman may sit in the same defence bucket, but the market does not always read them the same way. Lockheed is more closely tied to the F-35 and current air combat demand. Northrop is more closely linked to next-generation programs such as the B-21 Raider and Sentinel.
That gives this section its contrast. One is often read through the lens of current defence demand. The other is more closely tied to longer-cycle strategic modernisation.
$NOC| Q1 2026 REPORTING PERIOD
Northrop Grumman Corp.
NYSE | Defense | Space Systems | 23 Apr 2026
Estimated
Global Release Countdown (BMO)
00:00:00:00
Consensus EPS
US$6.12
Consensus Revenue
US$10.24 bn
AU | ASIA23 Apr | 10:30 pm
US | LATAM23 Apr | 8:30 am
Market Intelligence: $NOC
Analysis: NOC price drivers and scenarios
Consensus EPS
US$6.96
Quarterly analyst average
Order Backlog
US$95.7 billion
Record revenue visibility
FY 2026 EPS guide
US$27.40-US$27.90
Full-year 2026 outlook
AVG
LOW ~US$6.90AVG ~US$6.96HIGH US$7.20+
The consensus sits near the lower end of the analyst range. That offers a quick visual for whether the result is merely in line or strong enough to ease the guidance concerns that weighed on the stock after its last update. A result above US$7.20 may shift the conversation more materially.
Key swing factors for the result
Book-to-bill ratio
Currently at 1.10, suggesting orders are still running ahead of revenue recognition. This remains an important signal for multi-year growth visibility in defence.
Watch: 1.10 target
Guidance reset risk
Management’s guidance previously came in below market expectations. The market may be sensitive to any further softening in the 2026 outlook.
Watch: guidance commentary
Program concentration
The B-21 Raider and Sentinel carry outsized execution sensitivity. Updates on production ramp and funding may be the clearest drivers of sentiment for the stock.
Watch: B-21 and Sentinel updates
Capacity investment
Higher capital expenditure (capex) supports the industrial base over the longer term, but it may pressure near-term margins. Watch for signs that current investment is weighing on earnings power.
The result comes in above the cited threshold. Management says B-21 Raider production is ahead of schedule, with improving margins. Sentinel program restructuring costs remain below baseline expectations. International awards lift the book-to-bill ratio above 1.15.
Possible reaction: momentum may improve
Base case
EPS between US$6.00 and US$6.20, backlog steady at about US$95.7 billion
The result is broadly in line with the cited range. FCF targets for 2026 are reaffirmed but not expanded. Market focus shifts to organic sales growth metrics and segment operating margins. The initial reaction may depend on the timing of B-21 milestone payments.
The result lands near the low end of the analyst spread. Management flags higher infrastructure costs for Sentinel or delays in restricted space segment awards. Margin pressure in Aeronautics persists, and the 2026 revenue guide narrows towards the US$43.5 billion floor.
Possible reaction: shares may weaken
Reaction trigger to watch: The market response in the first 30 minutes after the result may indicate which scenario traders are leaning towards. A move above the prior session high on volume may support the bull case. A fade back into the range after an initial pop may point to the base case. A break below the prior session low on volume may suggest the bear case is gaining traction.
Sentiment Analysis · Northrop Grumman
Interactive scenario analysis: $NOC
Select earnings outcome
Stealth momentum
B-21 momentum, stronger execution and FCF support
EPS clears US$6.15. Management confirms a production capacity agreement for the B-21 Raider. Sentinel restructuring reaches Milestone B on schedule. Record backlog visibility and higher FCF guidance towards US$3.5 billion may support broader repositioning.
EPS outcome
Above US$6.15
B-21 Signal
Acceleration
FCF guide
$3.5 billionn range
Likely reaction
Momentum rally
Sources & Data Methodology
Sources: Reporting dates and release times are from company investor relations calendars where marked Confirmed; otherwise they are GO Markets estimates. Consensus EPS, revenue and analyst-range data are sourced from Bloomberg and Earnings Whispers, as at 7 April 2026 (AEDT). Company guidance, backlog and operating metrics are sourced from the latest company filings, results presentations or investor relations materials unless stated otherwise. Any scenario analysis reflects GO Markets analysis. Figures and schedules may change without notice.
Bottom line
In a market shaped by geopolitical risk and shifting rate expectations, companies with visible demand and longer-cycle revenue may continue to attract attention. But sentiment can still turn quickly if valuations are stretched, rate expectations shift again, or tensions in the Middle East ease.
That is why the story still needs to be tested against the numbers, not just the narrative. GO Markets will be analysing more companies throughout this earnings season. For more updates, visit our
earnings page,
follow our social media channels, or check the weekly newsletters.
Your next earnings setup starts here
Stay ahead of major beats, misses, and market surprises. Log in to your terminal, open a new account, or explore our dedicated earnings academy.