We are less than three weeks away from the ASX earning season and we are less than two weeks away from the earnings season in the US. So, we need to start prepping for trades and opportunities now. First and foremost, do not forget that confession season is well and truly upon us here in Australia.
Downgrades clearly have been coming from the discretionary sector; we've even seen companies hit the wall with the likes of Booktopia going into administration. There are some clear thematics that are growing in the Australian market. Energy, while the worst performing sector for the financial year 2024, may actually show you that earnings were slightly above expectation on higher than expected oil prices.
Materials led in the main by BHP, Rio and FMG Have once again benefited from higher than expected iron ore prices. It also benefited from a lower than expected AUD/USD where average FX prices were expected to be between $0.68 and $0.73 but instead have averaged between $0.63 and $0.67. What we're looking for is operational costs, overall margins and forward looking guidance, something that these firms have lacked in the last three financial updates.
Watch very closely for the excitement that will come from things like copper at the expense of the issues that are facing nickel lithium and other transition metals that have had really tough periods in FY24. Moving to the banks this is a sector people argue is fully valued. It's not hard to argue when through the financial year CBA made record all time highs several times and is still within a whisker of its record all time high.
Higher interest rates will indeed improve net interest margins. However, the unknown question and what we need to see at its August full year earnings is the impact higher rates are having on bad and doubtful debts, the possible increase in provisioning and more importantly the impact its having on new loans and refinancing. There is an argument to be made that banking is possibly fully priced and no matter what result is delivered won't necessarily create a leg further higher.
Finally, you can't go past consumer staples and discretionary. Retail sales numbers over the last 18 months have actually shown discretionary spending At or above 2022 levels although month on month figures have been erratic. The question that will come for discretionary spending is margins and how much sales revenue translates to the bottom line in earnings and profit.
Staples on the other hand have seen consistent movement on the revenue line but the question will be the margin and after the very targeted senate inquiry into supermarkets any sign profits are above trend may actually be met with concern as geopolitics raises its head. 33 times in 2024 the US 500 and the Tech 100 have made record highs – can it continue? Look into the US and the ending season that it is about to undertake. We have to look at several core thematics that are likely to be raised.
Artificial Intelligence (AI) The question you’ve got to ask is: is the time frame long or short? We raised this Mag 7 stocks etc Microsoft, Amazon, Alphabet, apple have clear potential. They are evolving their business models and see the integration of AI as the future of their individual businesses.
That will likely come up in their numbers but it will come with operational and initial upfront costs as the integration of AI begins. This is all long term may not fully capture short term opportunities which is still presenting very much in the semiconductor providers. NVIDIA and Advanced Micro Devices are taking full advantage and monetizing the compute cycle.
This clearly won't be forever because it will go from semiconductors to infrastructure to software and therefore the flows will move back towards the bigger end of town but overall the AI thematic still flows towards the semiconductors for now and that's likely to be shown in the earnings season that's coming. Data Centres That brings us to data centres because the potential for ensuring AI requires a heck of a lot of storage and a heck of a lot of processing. There are estimates the data centres will need to grow by 420% in Europe and 250% in the US by 2035 based on the rate of growth in AI right now.
Therefore, we need to watch providers like Dell Technologies and Intel which are big providers of data centres currently. We think the market hasn’t fully appreciated DC needs in the AI revolution. Cybersecurity The final key theme in the AI data centre technology space that we also think needs to be watched is cyber security.
It's been something along the lines of a 70% increase in ransomware attacks over the past 24 months. The regulatory requirements and the budgets required to deal with these increased threats is only just beginning. That brings players like Fortinet to the fore IT programmes and it's pensively to develop programs for enterprise makes it an interesting one going forward.
GLP-1 ‘Weight Loss’ Medicines Another theme of being a really strong driver of the S&P 500 is the rise of GLP-1 medicines. The weight loss craze that has come off the back of this Amazon has been incredible. Initially obviously developed for diabetes but having an additional effect of weight loss has created a product out of nowhere.
Eli Lilly and Co is a key player in this space with its GLP one class medicines already approved by the FDA. It's been launched in the US and its oral intake has posted adoption. It is not the only one in this space but shows very clearly the impact weight loss medicines are having on earnings.
The caveat we have though is side effects and long term impacts are still being found and could be said as a capping issue on price. Whatever way you look at it the US dating season however will be incredibly exciting and it is the reason The US markets continue to see huge capital inflows as they are much more exciting in this current environment than traditional value markets such as Australia.
By
Evan Lucas
The information provided is of general nature only and does not take into account your personal objectives, financial situations or needs. Before acting on any information provided, you should consider whether the information is suitable for you and your personal circumstances and if necessary, seek appropriate professional advice. All opinions, conclusions, forecasts or recommendations are reasonably held at the time of compilation but are subject to change without notice. Past performance is not an indication of future performance. Go Markets Pty Ltd, ABN 85 081 864 039, AFSL 254963 is a CFD issuer, and trading carries significant risks and is not suitable for everyone. You do not own or have any interest in the rights to the underlying assets. You should consider the appropriateness by reviewing our TMD, FSG, PDS and other CFD legal documents to ensure you understand the risks before you invest in CFDs.
Se você já passou algum tempo examinando um terminal de negociação, já o viu. Uma manchete de notícias é exibida, uma linha do gráfico se rompe e, de repente, todos correm para a mesma saída ou para a mesma entrada. Parece um caos. Na prática, geralmente é uma cadeia de respostas mecânicas.
Isso é importante por alguns motivos. Muitos leitores presumem que a história é uma profissão. Não é. A história, seja uma decisão sobre a taxa de juros, um choque na oferta ou uma perda de lucros, é o combustível e o manual é o motor.
Abaixo estão sete estratégias principais frequentemente usadas na negociação de contratos por diferença (CFDs). Com CFDs, você não está comprando o ativo subjacente. Você está especulando sobre a mudança no valor. Isso significa que um trader pode assumir uma posição longa se o preço subir ou uma posição curta se cair.
Sete estratégias para entender primeiro
1. Seguindo a tendência (o jogo do establishment)
O acompanhamento de tendências trabalha com base na ideia de que um mercado já em movimento pode permanecer em movimento até encontrar um obstáculo estrutural claro. Alguns participantes do mercado a veem como uma abordagem baseada em gráficos porque se concentra na direção predominante, em vez de tentar definir um ponto de inflexão exato.
A justificativa: O objetivo é identificar uma tendência direcional clara, como máximos e mínimos mais altos, e seguir esse impulso em vez de se posicionar contra ele.
O que os traders procuram: As médias móveis exponenciais (EMAs), como a EMA de 50 ou 200 dias, são comumente usadas para interpretar a força da tendência, embora os indicadores possam produzir sinais falsos e não sejam confiáveis por si só.
Fonte: GO Markets | Apenas exemplo educacional.
Como funciona: A EMA de 50 períodos pode atuar como um nível de suporte dinâmico que aumenta à medida que o preço sobe. Em uma tendência de alta, alguns traders observam que o mercado alcance uma nova alta (HH) e, em seguida, recuam em direção à EMA antes de subir novamente. Cada baixa mais alta (HL) pode sugerir que os compradores ainda estão no controle.
Quando o preço atinge ou se aproxima da EMA de 50 períodos durante essa retração, alguns traders tratam essa área como uma potencial zona de decisão, em vez de presumir que a tendência será retomada automaticamente.
O que assistir: A sequência de HhS e HLs faz parte da evidência estrutural de uma tendência. Se essa sequência quebrar, por exemplo, se o preço cair abaixo do HL anterior, a tendência pode estar enfraquecendo e a configuração pode não se manter mais.
2. Range trading (o jogo de pingue-pongue)
Os mercados podem passar longos períodos se movendo lateralmente. Isso cria um intervalo em que compradores e vendedores estão em equilíbrio temporário. A negociação de faixas é construída em torno desse comportamento, com foco em movimentos próximos à parte inferior e superior de uma faixa estabelecida.
A justificativa: O preço se move entre um piso, conhecido como suporte, e um teto, conhecido como resistência. Movimentos próximos a esses limites podem ajudar a definir a largura do intervalo.
O que os traders procuram: Alguns traders usam osciladores como o Índice de Força Relativa (RSI) para ajudar a avaliar se o ativo parece sobrecomprado ou sobrevendido perto de cada limite.
Fonte: GO Markets | Apenas exemplo educacional.
Como funciona: O nível de suporte é uma zona de preço em que os juros de compra têm sido historicamente fortes o suficiente para impedir que o mercado caia ainda mais. O nível de resistência é onde a pressão de venda historicamente impediu ganhos adicionais.
Quando o preço se aproxima do suporte, alguns traders procuram sinais de uma possível recuperação. Quando se aproxima da resistência, eles procuram sinais de que o ímpeto pode estar diminuindo. Leituras de RSI abaixo de 35 podem sugerir que o mercado está sobrevendido perto do suporte, enquanto leituras acima de 65 podem sugerir que ele está sobrecomprado perto da resistência.
O que assistir: O principal risco na negociação de faixas é uma ruptura, quando o preço sobe decisivamente para qualquer um dos níveis com forte impulso. Isso pode sinalizar o início de uma nova tendência e usar um stop-loss fora da faixa em cada negociação pode ajudar a gerenciar esse risco.
3. Breakouts (o jogo da mola em espiral)
Eventualmente, cada faixa fica sob pressão. Uma ruptura acontece quando o equilíbrio muda e o preço passa por suporte ou resistência. Os mercados alternam entre períodos de baixa volatilidade, em que o preço se move lateralmente em uma faixa estreita, e explosões de alta volatilidade, onde o preço pode fazer um movimento direcional maior.
A justificativa: Às vezes, uma consolidação silenciosa pode ser seguida por uma expansão mais ampla na volatilidade. Quanto mais apertada for a compressão, mais energia poderá ser armazenada para o próximo movimento.
O que os traders procuram: As bandas de Bollinger são frequentemente usadas para interpretar mudanças na volatilidade. Quando as faixas se apertam, um aperto está se formando. Alguns participantes do mercado veem uma mudança fora das faixas como um sinal de que as condições podem estar mudando.
Fonte: GO Markets | Apenas exemplo educacional.
Como funciona: As bandas de Bollinger consistem em uma linha média, a média móvel de 20 períodos e duas bandas externas que se expandem ou se contraem com base na recente volatilidade dos preços. Quando as faixas se estreitam e se aproximam, o aperto, o mercado fica excepcionalmente calmo.
Isso geralmente é descrito como uma mola em espiral. A energia pode estar se acumulando e um movimento mais nítido pode ocorrer. Alguns traders tratam o primeiro movimento através de uma faixa externa como uma pista inicial sobre a direção, em vez de um sinal definitivo por si só.
O que assistir: Nem todo aperto leva a uma forte fuga. Uma falsa quebra ocorre quando o preço se move brevemente para fora de uma banda e, em seguida, reverte rapidamente para dentro. Esperar que a vela se feche fora da faixa, em vez de entrar no meio da vela, pode reduzir o risco de ser pego em um movimento falso.
4. Negociação de notícias (o jogo de desvio)
Isso é negociação orientada por eventos. O foco está na lacuna entre o que o mercado esperava e o que os dados ou manchetes realmente forneceram. A divulgação de dados econômicos, como números de inflação (IPC), relatórios de emprego e decisões do banco central, pode causar movimentos bruscos e rápidos nos mercados financeiros.
A justificativa: Divulgações de alto impacto, como dados de inflação ou decisões do banco central, podem forçar uma rápida reavaliação dos ativos. Quanto maior a surpresa em relação às expectativas, maior pode ser a mudança.
O que os traders procuram: Os comerciantes costumam usar um calendário econômico para monitorar o tempo. Alguns se concentram em como o mercado se comporta após a reação inicial, em vez de tratar o primeiro movimento como definitivo.
Fonte: GO Markets | Apenas exemplo educacional.
Como funciona: Antes das notícias, o preço pode se mover em uma faixa calma e estreita enquanto os traders esperam. Quando os dados são divulgados, se a leitura real diferir significativamente da expectativa de consenso, a reprecificação pode acontecer rapidamente.
O ouro, por exemplo, pode aumentar drasticamente em uma leitura do IPC que esteja acima das expectativas. No entanto, a vela também pode imprimir um pavio superior muito longo, o que significa que o preço atingiu o pico máximo, mas foi fortemente rejeitado. Os vendedores podem intervir rapidamente e o preço pode diminuir. Esse padrão de pico e retrocesso é uma das configurações mais reconhecíveis na negociação de notícias.
O que assistir: A direção e o tamanho do pico inicial nem sempre contam a história completa. O comprimento do pavio pode oferecer uma pista importante. Um pavio longo pode sugerir que o movimento inicial foi rejeitado, enquanto mechas mais curtas após a liberação de dados podem indicar um movimento direcional mais sustentado.
5. Reversão média (o toque do elástico)
Às vezes, os preços podem subir muito, muito rápido. A reversão média se baseia na ideia de que um movimento exagerado pode voltar à sua média histórica, como um elástico apertado com muita força e depois recuando.
A justificativa: Essa é uma abordagem contrária. Ele busca períodos de otimismo ou pessimismo que podem não ser sustentáveis e posições para um retorno ao equilíbrio.
O que os traders procuram: Um exemplo comum é o preço se afastando bem de uma média móvel de 20 dias (MA), enquanto o RSI também atinge uma leitura extrema. Nessa configuração, os traders observam um retorno à média, em vez de uma continuação para longe dela.
Fonte: GO Markets | Apenas exemplo educacional.
Como funciona: O MA de 20 períodos representa o preço médio recente do mercado. Quando o preço se move para uma zona extrema, como mais de 3 desvios padrão acima ou abaixo dessa média, ele se afastou muito de sua tendência recente.
Um RSI acima de 70 pode sugerir que o mercado está esticado para cima, enquanto abaixo de 30 pode sugerir o mesmo para o lado negativo. Alguns negociadores de reversão significam que usam esses sinais combinados como um sinal de que uma retração em direção à MA de 20 períodos pode ser possível, em vez de presumir que o movimento continuará a se estender.
O que assistir: As estratégias de reversão média podem acarretar riscos significativos em mercados com fortes tendências. Um mercado pode permanecer estendido por mais tempo do que o esperado, e uma posição inserida contra a tendência de curto prazo pode gerar grandes rebaixamentos. O dimensionamento da posição e os stop-loss claros são essenciais.
6. Níveis psicológicos (o grande jogo de figuras)
Os mercados são movidos por pessoas, e as pessoas tendem a se concentrar em números redondos. USD 100, USD 2.000 ou paridade de 1.000 em um par de moedas podem atuar como ímãs. Nos mercados financeiros, certos níveis de preços podem atrair uma quantidade desproporcional de atividades de compra e venda, não apenas por causa da análise técnica, mas por causa da psicologia humana.
A justificativa: Grandes pedidos, níveis de stop-loss e take-profit podem se agrupar em torno desses grandes números, o que pode reforçar o suporte ou a resistência. Esse comportamento de autorreforço é uma das razões pelas quais essas rejeições podem se tornar significativas para os comerciantes.
O que os traders procuram: Os comerciantes geralmente observam como o preço se comporta à medida que se aproxima de um número redondo. O mercado pode hesitar, rejeitar o nível ou ultrapassá-lo com impulso. Várias rejeições de pavio no mesmo nível podem ter mais peso do que uma única.
Fonte: GO Markets | Apenas exemplo educacional.
Como funciona: Quando o preço se aproxima de um número redondo vindo de baixo, alguns traders observam mechas superiores longas, a fina linha vertical acima do corpo da vela. Um longo pavio superior significa que o preço atingiu esse nível, mas os vendedores intervieram agressivamente e o empurraram para baixo antes que a vela se fechasse.
Uma rejeição de um pavio pode ser notável. Três em um cluster podem ser mais significativos. Alguns traders usam essa rejeição acumulada como parte do caso de uma configuração curta (venda) nesse nível.
O que assistir: Os níveis psicológicos também podem atuar como ímãs na direção oposta. Se o preço ultrapassar com convicção, o nível poderá então atuar como suporte. Um fechamento decisivo acima do nível, em vez de apenas uma quebra do pavio, pode ser um sinal precoce de que a configuração de rejeição não está mais se mantendo.
7. Rotação setorial (o jogo da temporada econômica)
Essa é uma estratégia macro. À medida que o cenário econômico muda, o capital pode passar de setores de maior crescimento para setores mais defensivos e vice-versa. Nem todas as partes do mercado de ações se movem na mesma direção ao mesmo tempo.
A justificativa: Em uma economia em desaceleração, os gastos discricionários podem enfraquecer, enquanto a demanda por serviços essenciais pode permanecer mais estável. Os investidores podem alternar o capital entre os setores adequadamente.
O que os traders procuram: Com CFDs, alguns negociadores expressam essa visão por meio de força relativa, expondo-se a um setor mais forte e reduzindo ou compensando a exposição a um setor mais fraco.
Fonte: GO Markets | Apenas exemplo educacional.
Como funciona: Durante uma fase de crescimento, quando a economia está se expandindo, os investidores tendem a preferir setores voltados para o crescimento, como a tecnologia. À medida que o ambiente econômico muda, talvez devido ao aumento das taxas de juros, à desaceleração dos lucros ou ao aumento do risco de recessão, um ponto de rotação pode surgir.
Na fase de desaceleração, o padrão pode se reverter. A tecnologia pode enfraquecer, enquanto as concessionárias podem se fortalecer, à medida que os investidores transferem capital para setores defensivos e geradores de renda. Os sinais iniciais podem incluir um desempenho relativamente baixo em setores de crescimento combinado com uma força incomum nas defensivas.
O que assistir: A rotação de setores geralmente não é um evento noturno. Normalmente se desenrola ao longo de semanas a meses. Rastrear a relação entre dois setores, geralmente mostrada em um gráfico de força relativa, pode tornar essa mudança visível antes que se torne óbvia em termos absolutos de preço.
Por que o gerenciamento de riscos é o motor da sobrevivência
A mudança da manchete é uma coisa. A implicação do mercado para sua conta é outra. Se você não gerencia a mecânica, a estratégia não importa.
Como os CFDs são negociados com margem, um pequeno movimento do mercado pode ter um impacto enorme na conta. Se a alavancagem for muito alta, até mesmo uma pequena oscilação pode desencadear uma chamada de margem ou o fechamento automático da posição, dependendo dos termos do provedor. Isso não é um risco teórico. É um motivo comum pelo qual os novos negociadores perdem mais do que esperavam em uma negociação direcionalmente correta.
O mercado nem sempre se move em linha reta. Às vezes, diferenças de preço de um nível para outro, especialmente após um fim de semana ou um grande evento noticioso e, nessas condições, um stop-loss pode não ser preenchido com o preço exato solicitado. Isso é conhecido como deslizamento. Essa é uma das razões pelas quais grandes posições podem acarretar riscos adicionais em grandes anúncios.
Conclusão
O veículo é poderoso, mas o manual é o que ajuda a mantê-lo na estrada.
A negociação óbvia geralmente já está cotada. O que importa mais é entender qual condição de mercado está à sua frente. É uma tendência, uma variedade, um sucesso ou simplesmente uma reação a uma manchete?
Os leitores que avaliam produtos alavancados geralmente se concentram no tamanho da posição, nos limites de risco e na divulgação do produto antes de decidir se o produto é apropriado para eles. As manchetes continuarão mudando. A matemática do gerenciamento de riscos não.
Isenção de responsabilidade: Este artigo é apenas para informações gerais e tem fins educacionais. Ele explica conceitos comuns de negociação e comportamentos de mercado e não constitui um conselho sobre produtos financeiros, uma recomendação ou um sinal de negociação. Todos os exemplos são meramente ilustrativos e não levam em consideração seus objetivos, situação financeira ou necessidades. Os CFDs são produtos complexos e alavancados que apresentam um alto nível de risco. Antes de agir, considere o PDS e o TMD e se negociar CFDs é apropriado para você. Procure aconselhamento independente, se necessário. O desempenho passado não é um indicador confiável de resultados futuros.
A volatilidade tem um jeito de aparecer sem ser convidada.
Um dia, o ASX está flutuando silenciosamente... e no outro, os requisitos de margem aumentam, as paradas não são preenchidas onde o esperado e os portfólios abrem com lacunas desconfortáveis da noite para o dia.
Se você está procurando por respostas, não está sozinho. Algumas das perguntas mais pesquisadas sobre volatilidade entre os negociadores australianos estão relacionadas a chamadas de margem, derrapagens, lacunas noturnas, fundos negociados em bolsa (ETFs) alavancados e ferramentas como o Average True Range (ATR).
Aqui está o que está acontecendo.
Por que isso importa agora
Os mercados globais se tornaram mais sensíveis às taxas de juros, dados de inflação, geopolítica e fluxos impulsionados pela tecnologia. Quando a liquidez diminui e a incerteza aumenta, as oscilações de preços aumentam. Isso é volatilidade.
E a volatilidade não afeta apenas a direção dos preços, ela muda a forma como as negociações são executadas, quanto capital é necessário e como o risco se comporta sob a superfície.
Tradução: A volatilidade não se trata apenas de movimentos maiores, mas sim de movimentos mais rápidos e menor liquidez - é aí que a mecânica da negociação é mais importante.
Por que meu corretor aumentou os requisitos de margem?
Uma das perguntas mais pesquisadas sobre volatilidade é por que os requisitos de margem aumentam sem aviso prévio.
Quando os mercados se tornam instáveis, os corretores podem aumentar os requisitos de margem em contratos por diferença (CFDs) e outros produtos alavancados. Grandes oscilações de preço podem aumentar o risco de contas entrarem em patrimônio líquido negativo, portanto, aumentar os requisitos de margem reduz a alavancagem disponível e pode ajudar a gerenciar a exposição em condições extremas.
O que isso pode significar na prática
-Uma chamada de margem pode ocorrer mesmo que o preço não tenha se movido significativamente. -A alavancagem efetiva pode cair rapidamente. -As posições podem precisar ser reduzidas em curto prazo.
Os ajustes de margem geralmente são uma resposta à mudança do risco de mercado, não uma decisão aleatória. Em mercados altamente voláteis, é prudente presumir que as configurações de margem podem mudar rapidamente, portanto, muitos negociadores optam por revisar os tamanhos das posições e os buffers disponíveis à luz desse risco.
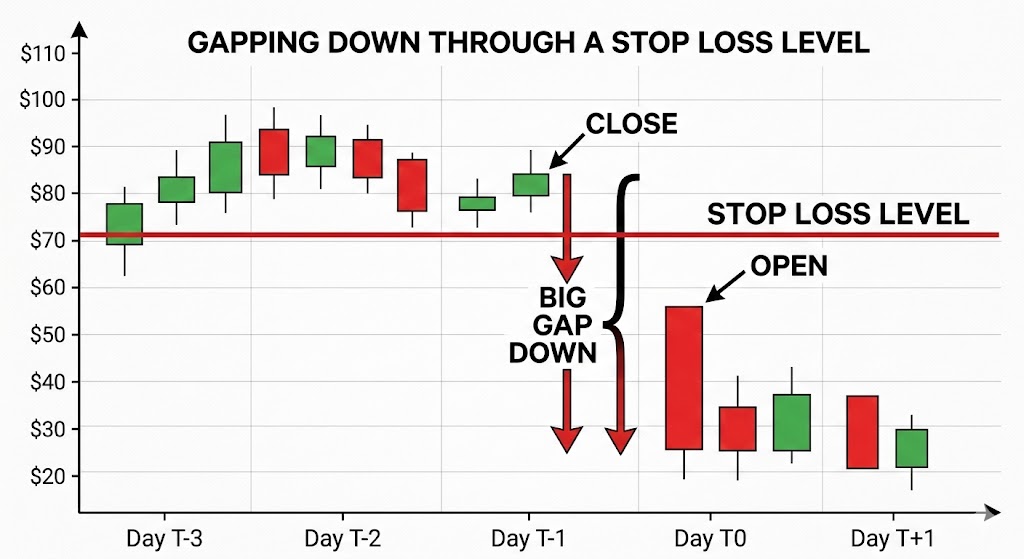
O que é deslizamento e por que meu batente não preencheu meu preço?
Outro tópico pesquisado com frequência é o deslizamento.
A derrapagem pode ocorrer quando uma ordem de parada é acionada e executada no próximo preço disponível. O resultado pode depender do tipo de pedido, da liquidez do mercado e das lacunas. Em mercados calmos, a diferença pode ser pequena, enquanto em mercados rápidos, os preços podem ultrapassar o nível de parada.
Ilustração da diferença de preço em relação ao nível de stop-loss | GO Markets
Os drivers comuns incluem
-Principais divulgações econômicas ou de resultados. - Liquidez escassa. - Pisos de parada lotados. - Sessões noturnas.
As ordens de stop-loss geralmente priorizam a execução em vez da certeza do preço e, durante períodos de alta volatilidade, essa distinção se torna importante. Ajustar o tamanho da posição e colocar paradas com referência ao movimento típico de preços pode ser mais eficaz do que simplesmente apertar as paradas em condições instáveis.
Como faço para gerenciar lacunas noturnas no ASX?
A Austrália negocia enquanto os Estados Unidos dormem e vice-versa. Essa diferença de fuso horário é, infelizmente, uma das razões pelas quais o risco de lacuna noturna é frequentemente pesquisado pelos comerciantes australianos. Se os mercados dos EUA caírem drasticamente, o ASX poderá abrir em baixa na manhã seguinte, sem oportunidade de sair entre o fechamento e a abertura.
Exemplos de abordagens de gerenciamento de risco que os traders do mercado podem usar incluem
-Cobertura de índices usando futuros ASX 200 ou CFDs*. -Cobertura parcial durante eventos de alto risco. -Reduzir a exposição antes dos principais anúncios macro.
O hedge pode compensar parte de um movimento, mas introduz um risco básico, pois as ações individuais podem não se mover de acordo com o índice mais amplo.
Não há proteção perfeita, apenas compensações entre custo, complexidade e redução de riscos.
*Os CFDs são instrumentos complexos e apresentam um alto risco de perda de dinheiro devido à alavancagem.
Quais são os principais riscos dos ETFs alavancados ou inversos em mercados voláteis?
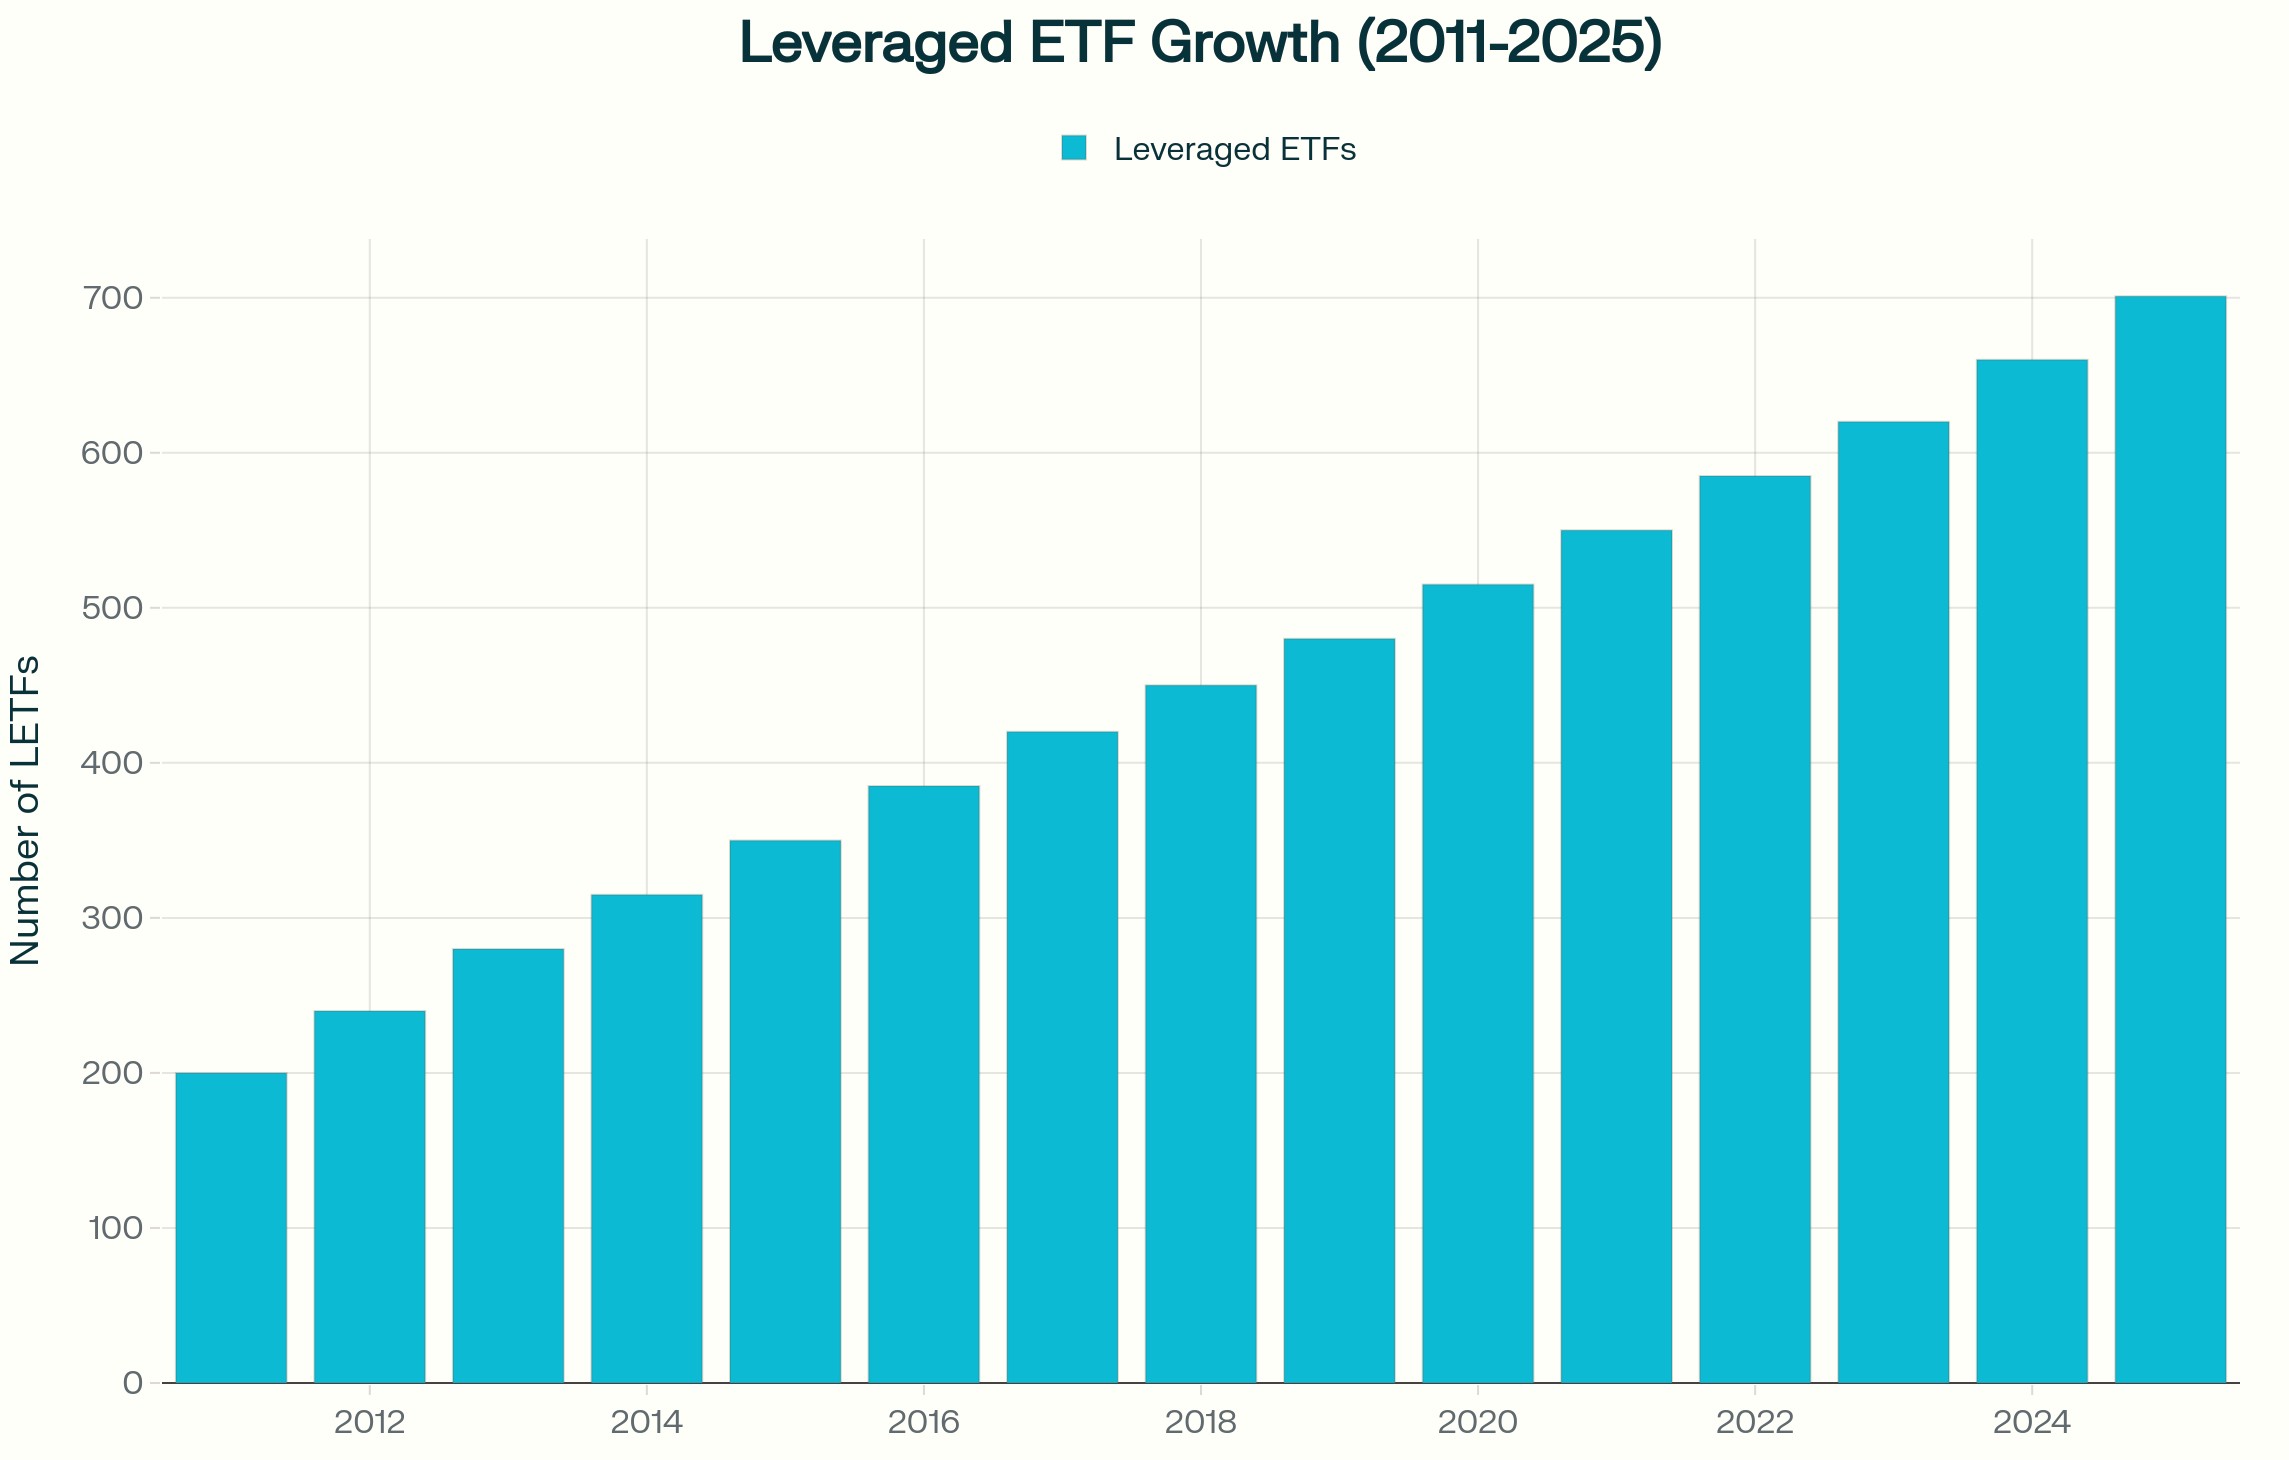
Os ETFs alavancados e inversos são frequentemente pesquisados durante períodos de maior volatilidade.
Embora esses produtos normalmente sejam reinicializados diariamente, eles visam gerar um múltiplo do retorno diário do índice, não seu retorno de longo prazo. Em um mercado volátil e lateral, a composição diária pode corroer o valor, mesmo que o índice termine próximo ao nível inicial.
Crescimento alavancado do ETF (2011—2025) | Fonte: Investing.com
Isso ocorre porque os ganhos e as perdas se acumulam de forma assimétrica. Uma queda de 10 por cento exige um ganho de mais de 10 por cento para se recuperar. Quando esse efeito é multiplicado diariamente, os resultados podem divergir materialmente do índice subjacente ao longo do tempo.
Esses instrumentos podem ser usados taticamente por alguns participantes do mercado. Eles geralmente não são projetados como ferramentas de hedge de longo prazo e entender sua estrutura é essencial antes de usá-los em uma estratégia.
Como o ATR pode ser usado para informar o posicionamento da parada??
O intervalo médio real (ATR) é um indicador comumente usado para medir a volatilidade.
O ATR estima o quanto um ativo normalmente se move em um determinado período, incluindo lacunas. Em vez de definir um stop em uma porcentagem arbitrária, alguns traders fazem referência ao ATR e colocam os stops em um múltiplo, como duas ou três vezes o ATR, para refletir as condições prevalecentes.
Quando a volatilidade aumenta, o ATR se expande e isso pode implicar paradas maiores ou tamanhos de posição menores para que o risco geral permaneça constante. A mudança é deixar de perguntar: “Até onde estou disposto a perder?” a perguntar: “O que é um movimento normal nas condições atuais?”
Considerações práticas em mercados voláteis
Durante períodos de elevada volatilidade, os traders podem considerar
Permitindo a possibilidade de mudanças de margem
Dimensionar posições de forma conservadora se a volatilidade aumentar
Reconhecendo que as ordens de stop-loss não garantem um preço de saída específico
Analisando a exposição antes de grandes eventos econômicos
Entendendo a mecânica diária de redefinição de ETFs alavancados
Usando medidas de volatilidade, como ATR, para informar o posicionamento da parada
Manter amortecedores de caixa adequados
A volatilidade não recompensa apenas a previsão. A preparação e a conscientização sobre os riscos podem ajudar os negociadores a entender os riscos potenciais, mas os resultados permanecem imprevisíveis.
O que isso significa para os comerciantes australianos
Os mercados australianos enfrentam considerações estruturais específicas em comparação com os mercados asiático e americano. O risco de lacuna noturna é influenciado pelo horário de negociação dos EUA e índices pesados de recursos, como o ASX, podem responder rapidamente aos movimentos dos preços das commodities e aos dados da China. A exposição cambial, incluindo movimentos de AUD e dólar americano (USD), pode adicionar outra camada de variabilidade.
A volatilidade não é uniforme entre as regiões. Ele se comporta de maneira diferente dependendo da estrutura do mercado e da profundidade da liquidez.
Perguntas frequentes sobre volatilidade
O que causa picos repentinos na volatilidade do mercado? Decisões sobre taxas de juros, dados de inflação, desenvolvimentos geopolíticos, surpresas de lucros e restrições de liquidez são gatilhos comuns.
Por que os corretores aumentam a margem em mercados voláteis? Reduzir a exposição à alavancagem e gerenciar o risco quando as oscilações de preço aumentam.
As ordens de stop-loss podem falhar durante a volatilidade? Eles podem sofrer derrapagens se os mercados ultrapassarem o nível de parada, o que significa que a execução pode ocorrer a um preço pior do que o esperado. Em mercados rápidos ou ilíquidos, essa diferença pode ser significativa.
Os ETFs alavancados são adequados para cobertura de longo prazo? Eles geralmente são estruturados para exposição de curto prazo devido a reinicializações diárias. Se eles são apropriados depende de seus objetivos, situação financeira e tolerância ao risco.
Como a volatilidade pode ser medida antes de fazer uma negociação? Ferramentas como ATR, indicadores de volatilidade implícitos e análise de intervalo histórico podem ajudar a quantificar as condições prevalecentes.
Aviso de risco: períodos de maior volatilidade podem levar a movimentos rápidos de preços, mudanças de margem e execução a preços diferentes dos esperados. Ferramentas de gerenciamento de risco, como ordens de stop-loss e indicadores de volatilidade, podem ajudar na avaliação das condições do mercado, mas não podem eliminar o risco de perda, especialmente ao usar produtos alavancados.
We are less than three weeks away from the ASX earning season and we are less than two weeks away from the earnings season in the US. So, we need to start prepping for trades and opportunities now. First and foremost, do not forget that confession season is well and truly upon us here in Australia.
Downgrades clearly have been coming from the discretionary sector; we've even seen companies hit the wall with the likes of Booktopia going into administration. There are some clear thematics that are growing in the Australian market. Energy, while the worst performing sector for the financial year 2024, may actually show you that earnings were slightly above expectation on higher than expected oil prices.
Materials led in the main by BHP, Rio and FMG Have once again benefited from higher than expected iron ore prices. It also benefited from a lower than expected AUD/USD where average FX prices were expected to be between $0.68 and $0.73 but instead have averaged between $0.63 and $0.67. What we're looking for is operational costs, overall margins and forward looking guidance, something that these firms have lacked in the last three financial updates.
Watch very closely for the excitement that will come from things like copper at the expense of the issues that are facing nickel lithium and other transition metals that have had really tough periods in FY24. Moving to the banks this is a sector people argue is fully valued. It's not hard to argue when through the financial year CBA made record all time highs several times and is still within a whisker of its record all time high.
Higher interest rates will indeed improve net interest margins. However, the unknown question and what we need to see at its August full year earnings is the impact higher rates are having on bad and doubtful debts, the possible increase in provisioning and more importantly the impact its having on new loans and refinancing. There is an argument to be made that banking is possibly fully priced and no matter what result is delivered won't necessarily create a leg further higher.
Finally, you can't go past consumer staples and discretionary. Retail sales numbers over the last 18 months have actually shown discretionary spending At or above 2022 levels although month on month figures have been erratic. The question that will come for discretionary spending is margins and how much sales revenue translates to the bottom line in earnings and profit.
Staples on the other hand have seen consistent movement on the revenue line but the question will be the margin and after the very targeted senate inquiry into supermarkets any sign profits are above trend may actually be met with concern as geopolitics raises its head. 33 times in 2024 the US 500 and the Tech 100 have made record highs – can it continue? Look into the US and the ending season that it is about to undertake. We have to look at several core thematics that are likely to be raised.
Artificial Intelligence (AI) The question you’ve got to ask is: is the time frame long or short? We raised this Mag 7 stocks etc Microsoft, Amazon, Alphabet, apple have clear potential. They are evolving their business models and see the integration of AI as the future of their individual businesses.
That will likely come up in their numbers but it will come with operational and initial upfront costs as the integration of AI begins. This is all long term may not fully capture short term opportunities which is still presenting very much in the semiconductor providers. NVIDIA and Advanced Micro Devices are taking full advantage and monetizing the compute cycle.
This clearly won't be forever because it will go from semiconductors to infrastructure to software and therefore the flows will move back towards the bigger end of town but overall the AI thematic still flows towards the semiconductors for now and that's likely to be shown in the earnings season that's coming. Data Centres That brings us to data centres because the potential for ensuring AI requires a heck of a lot of storage and a heck of a lot of processing. There are estimates the data centres will need to grow by 420% in Europe and 250% in the US by 2035 based on the rate of growth in AI right now.
Therefore, we need to watch providers like Dell Technologies and Intel which are big providers of data centres currently. We think the market hasn’t fully appreciated DC needs in the AI revolution. Cybersecurity The final key theme in the AI data centre technology space that we also think needs to be watched is cyber security.
It's been something along the lines of a 70% increase in ransomware attacks over the past 24 months. The regulatory requirements and the budgets required to deal with these increased threats is only just beginning. That brings players like Fortinet to the fore IT programmes and it's pensively to develop programs for enterprise makes it an interesting one going forward.
GLP-1 ‘Weight Loss’ Medicines Another theme of being a really strong driver of the S&P 500 is the rise of GLP-1 medicines. The weight loss craze that has come off the back of this Amazon has been incredible. Initially obviously developed for diabetes but having an additional effect of weight loss has created a product out of nowhere.
Eli Lilly and Co is a key player in this space with its GLP one class medicines already approved by the FDA. It's been launched in the US and its oral intake has posted adoption. It is not the only one in this space but shows very clearly the impact weight loss medicines are having on earnings.
The caveat we have though is side effects and long term impacts are still being found and could be said as a capping issue on price. Whatever way you look at it the US dating season however will be incredibly exciting and it is the reason The US markets continue to see huge capital inflows as they are much more exciting in this current environment than traditional value markets such as Australia.
O anúncio do cessar-fogo de 8 de abril e as discussões paralelas em torno de uma trégua de 45 dias não resolveram a interrupção do Estreito de Ormuz. Por enquanto, eles limitaram o pior cenário possível, mas o tráfego de petroleiros permanece em uma fração dos níveis normais e a demanda do Irã por taxas de trânsito sinaliza uma mudança estrutural, não temporária.
O que começou como um conflito regional se tornou um choque energético global, e a questão para os mercados não é mais se Ormuz foi interrompida, mas como a interrupção muda permanentemente o piso de preços do petróleo.
Principais conclusões
Cerca de 20 milhões de barris por dia (bpd) de petróleo e produtos petrolíferos normalmente passam pelo Estreito de Ormuz, entre o Irã e Omã, o equivalente a cerca de um quinto do consumo global de petróleo e cerca de 30% do comércio marítimo global de petróleo.
Isso é um choque de fluxo, não um problema de estoque. Os mercados de petróleo dependem do rendimento contínuo, não do armazenamento estático.
Se a interrupção persistir além de algumas semanas, o Brent poderá passar de um pico de curto prazo para um choque de preços mais amplo, com risco de estagflação.
O tráfego de petroleiros pelo estreito caiu de cerca de 135 navios por dia para menos de 15 no pico da interrupção, uma redução de aproximadamente 85%, com mais de 150 embarcações ancoradas, desviadas ou atrasadas.
Um cessar-fogo de duas semanas foi anunciado em 8 de abril, com negociações de trégua de 45 dias em andamento. O Irã sinalizou separadamente uma demanda por taxas de trânsito em embarcações que usam o estreito, o que, se formalizado, representaria um piso geopolítico permanente nos custos de energia.
Os mercados começaram a se afastar do crescimento e da exposição à tecnologia para nomes de energia e defesa, refletindo a visão de que o petróleo elevado está se tornando um custo estrutural em vez de um prêmio de risco temporário.
Institutional Grade Performance
Master the Markets with MetaTrader 5
Trade hundreds of instruments with superior speed and advanced technical analysis. Harness full EA functionality to execute your strategy.
O ponto de estrangulamento de petróleo mais crítico do mundo
O Estreito de Ormuz movimenta cerca de 20 milhões de barris por dia de petróleo e produtos petrolíferos, o equivalente a cerca de 20% do consumo global de petróleo e cerca de 30% do comércio marítimo global de petróleo. Com a demanda global de petróleo em torno de 104 milhões de bpd e a capacidade não utilizada limitada, o mercado já estava fortemente equilibrado antes da última escalada.
O estreito também é um corredor crítico para o gás natural liquefeito. Cerca de 290 milhões de metros cúbicos de GNL transitaram pela rota todos os dias, em média, em 2024, representando cerca de 20% do comércio global de GNL, com os mercados asiáticos como principal destino.
A Agência Internacional de Energia (IEA) descreveu Ormuz como o ponto de estrangulamento do trânsito de petróleo mais importante do mundo, observando que mesmo interrupções parciais podem desencadear grandes movimentos de preços. O petróleo Brent subiu acima de USD 100 o barril, refletindo tanto a rigidez física quanto o aumento do prêmio de risco geopolítico.
Fonte: Administração de Informações sobre Energia dos EUA, datada de 17 de junho de 2025, usando a média diária de 2024
Tanques ociosos enquanto os fluxos diminuem
Os dados de frete e seguro agora apontam para problemas em tempo real. Relata-se que mais de 85 grandes transportadores de petróleo bruto estão presos no Golfo Pérsico, enquanto mais de 150 navios foram ancorados, desviados ou atrasados à medida que os operadores reavaliam a segurança e a cobertura do seguro. Isso deixaria cerca de 120 milhões a 150 milhões de barris de petróleo bruto parados no mar.
Esses volumes representam apenas seis a sete dias de produção normal de Ormuz, ou pouco mais de um dia de consumo global de petróleo.
Os dados atualizados de transporte e seguro agora confirmam que mais de 150 embarcações foram ancoradas, desviadas ou atrasadas, acima das 85 relatadas inicialmente. Os 1,3 dias de cobertura do consumo global de petróleo bruto ocioso continuam sendo a restrição vinculativa: isso é um choque de fluxo, não um problema de armazenamento, e o cessar-fogo ainda não se traduziu em uma produtividade significativamente restaurada.
🌋 Trump, volatility and Hormuz.
As tariff shocks collide with a ten year extreme in oil positioning, the margin for error is zero. See the technical markers and safe haven pivots defining the current risk environment.
Os mercados de petróleo funcionam em movimento contínuo. Refinarias, plantas petroquímicas e cadeias de suprimentos globais são calibradas para entregas estáveis ao longo de rotas marítimas previsíveis. Quando os fluxos passam por um ponto de estrangulamento que carrega cerca de um quinto do consumo global de petróleo e cerca de 30% do comércio marítimo global de petróleo são interrompidos, o sistema pode passar do equilíbrio ao déficit em poucos dias.
A capacidade de produção não utilizada, amplamente concentrada na OPEP, é estimada em apenas 3 milhões a 5 milhões de bpd. Isso fica bem aquém dos volumes em risco se os fluxos de Ormuz forem severamente interrompidos.
GO Markets — Idle Tankers: Days of Cover
Oil market analysis
How long do idle tankers last?
135M idle barrels — days of cover against each demand benchmark
vs. Strait of Hormuz daily flow (20M bbl/day)
6.75 daysof Hormuz throughput covered
6.75 days
0
5
10
15
20
25
30 days
vs. Global oil consumption (104M bbl/day)
1.3 daysof world demand covered
1.3 days
0
5
10
15
20
25
30 days
vs. US Strategic Petroleum Reserve release (1M bbl/day)
135 daysof full SPR release pace covered
135 days — but SPR exists to replace this role
0
5
10
15
20
25
30 days
135M
idle barrels on tankers (midpoint of 120–150M range)
~33%
of daily Hormuz flow that is idle storage, not transit
<31 hrs
is all idle storage against global daily consumption
Indicative market trajectories based on disruption severity
Scenarios for the weeks ahead
1–2 WEEKS
Ceasefire catch-up
Markets face catch-up repricing. Brent could consolidate in the US$105–US$115 range as risk premia unwind. Brent may trade lower (US$95–US$110) if strategic stocks bridge the temporary shortfall.
2–4 WEEKS
Infrastructure blitz
Shifts to structural supply shock. Brent moving toward US$150–US$200 cannot be ruled out. This is the stagflation trigger where energy costs constrain central bank flexibility.
STRUCTURAL
Geopolitical floor
Iran's transit fee demand creates a permanent input cost. The pre-crisis price structure (US$60–US$70) may not return, embedded in insurance and freight rates.
Critical Threshold
US$120 remains the level at which energy inflation becomes a direct Federal Reserve policy problem.
Riscos de inflação e repercussões macro
O impacto inflacionário de um choque de petróleo normalmente chega em ondas. Preços mais altos de combustível e energia podem elevar a inflação global rapidamente, à medida que os custos de gasolina, diesel e energia aumentam.
Com o tempo, custos mais altos de energia podem passar por frete, alimentos, manufatura e serviços. Se a interrupção persistir, a combinação de inflação elevada e crescimento mais lento pode aumentar o risco de um ambiente estagflacionário e deixar os bancos centrais enfrentando uma difícil troca.
🛢️ Brent hits $100.
Exxon and SLB are leading the rotation out of tech. Get the price targets and technical support levels for the top 5 energy majors.
O que torna o episódio atual particularmente agudo é a falta de folga no sistema global.
A oferta e a demanda globais de cerca de 103 milhões a 104 milhões de bpd deixam pouca reserva quando um ponto de estrangulamento que movimenta quase 20 milhões de bpd, ou cerca de um quinto do consumo global de petróleo, é comprometido. A capacidade não utilizada estimada de 3 milhões a 5 milhões de bpd, principalmente dentro da OPEP, cobriria apenas uma fração dos volumes em risco.
Rotas alternativas, incluindo oleodutos que contornam Ormuz e reencaminhamentos marítimos, só podem compensar parcialmente os fluxos perdidos e, geralmente, com custos mais altos e prazos de entrega mais longos.
Conclusão
Até que o trânsito pelo Estreito de Ormuz seja restaurado e visto como confiavelmente seguro, é provável que os fluxos globais de petróleo permaneçam prejudicados e os prêmios de risco elevados. Para investidores, formuladores de políticas e tomadores de decisão corporativos, a questão central é se o petróleo pode se mover para onde precisa ir, todos os dias, sem interrupção.
Market Opportunity
Don't just watch the squeeze. Trade the framework.
As positioning gaps hit decade extremes, access advanced charting tools and real time execution on the six key markets defining this cycle.
Uma manchete sobre uma civilização “morrendo hoje à noite” foi criada para impressionar, mas o sinal mais revelador pode ser a calma subjacente, porque os mercados estão começando a tratar esse ciclo de forte escalada seguido por uma redução repentina como um padrão, não uma surpresa.
Em círculos macro, esse padrão tem um rótulo contundente: TACO, ou “Trump Always Chickens Out”. A frase está carregada, mas a lógica é simples. Uma ameaça de pressão máxima ocorre, os ativos de risco oscilam e, em seguida, surge uma pausa, atraso ou resultado mais fraco quando o custo econômico começa a diminuir.
Isso não significa que o risco seja pequeno. Isso pode significar apenas que os investidores se acostumaram com um roteiro em que a retórica explode, os mercados absorvem o choque e a contenção aparece antes que o pior cenário chegue totalmente.
Developing situation
|
Strait of Hormuz | Section 122 Tariffs
PublishedApril 2026
Brent CrudeAbove US$100
VIX31
In focus6 markets
Oil PositioningDecade-low longs
The Framework & MechanismIs the market the red line?
+
This is where the TACO idea starts to matter. Traders are not just watching the rhetoric. They are watching when it starts to hit markets, inflation and the wider economy.
Oil is at the centre of that risk. If disruption around the Strait of Hormuz starts to threaten global energy flows, the story quickly becomes macro. Higher oil can lift inflation expectations, pressure central banks and tighten financial conditions.
That is why a pause can look less like diplomacy and more like pressure relief. The real red line may be the point where the economic damage becomes too obvious to ignore.
Short Squeezed
Positioning adds another layer. Oil still looks under-owned, with futures positioning near decade-long bearish extremes. If a fresh shock lands, short-covering could drive prices higher much faster than fundamentals alone would suggest.
That is the short-squeeze risk. In the Commitment of Traders (COT) report, recent data suggests oil long exposure is relatively low by historical standards.
Humanitarian Reality
Whatever may be promised in political messaging, any sustained conflict in Iran would carry a heavy cost in displacement, infrastructure damage and wider regional stress. A relief rally in markets does not change that.
Global Isolation
Even if pauses are used to steady domestic market sentiment, allies and multilateral institutions may view bluff-and-retreat tactics as a credibility problem that creates longer-term diplomatic friction.
Positioning gap indicator
Divergence analysis between positioning and risk environment
APRIL 2026
Bars show GO Markets’ internal estimate of the divergence between current futures positioning and levels seen in comparable historical shock environments.
Brent crudeExtreme
Gold (XAU/USD)Very high
Nasdaq 100High
USD/CNHHigh
US 10 yr yieldMedium
USD/CADMedium
Extreme decade scale positioning extreme
High significant divergence
Medium moderate divergence
Methodology note
The Positioning Gap Indicator is based on GO Markets’ internal analysis and is intended as a high-level, illustrative framework only. It uses a combination of market positioning data, historical comparisons and discretionary assumptions about how similar energy and trade shocks have affected markets in the past. The ‘Extreme’, ‘Very High’, ‘High’ and ‘Medium’ labels are relative internal classifications, not objective market standards, and should not be relied on as predictions, forecasts or a guarantee of future outcomes.
The Six Markets
The six markets that matter most
Each of these six markets is exposed to the current situation through a different mechanism. Understanding the mechanism, not just the price, matters. It helps explain whether a move is a headline reaction or the start of something broader. Tap any card to expand the full analysis.
01
BRENT
Brent crude oil
ENERGYDIRECT CHANNELSQUEEZE RISK: EXTREME
+
The Clear Transmission Channel
Brent is the international benchmark for crude and the most direct transmission mechanism in this geopolitical thesis. Any disruption to physical flows, particularly through the Strait of Hormuz, forces an immediate tightening of global energy supply.
The Positioning Backdrop
Futures positioning currently sits at a ten year bearish extreme. Leveraged funds have cut long exposure heavily. In the event of a physical supply shock, this imbalance creates the potential for a violent short covering squeeze.
● Bull Case
Hormuz disruption extends beyond four weeks. Extended disruption could lift Brent sharply if supply flows are impaired for longer.
● Bear Case
Diplomatic intervention reopens the strait quickly. Strategic petroleum reserve (SPR) releases and increased spare capacity cap any price rally.
Strategic Marker
US$120: the point at which energy inflation becomes a direct Federal Reserve policy problem, rather than just a market narrative.
02
XAU/USD
Gold
SAFE HAVENUNDER-OWNEDSQUEEZE RISK: VERY HIGH
+
The Counter-Intuitive Setup
Despite a clear geopolitical risk profile, leveraged funds have been reducing bullish gold exposure. This leaves the market under-owned at the exact moment the fundamental case for safe haven assets is strengthening.
The Inflation Variable
The critical factor for Gold is whether energy-driven inflation limits the Fed's room to maneuver. If policy flexibility weakens, Gold could catch up quickly as a hedge against stagflation.
● Bull Case
Real yields fall as energy inflation outpaces rate hikes. Under-owned positioning amplifies the catch up move as institutional funds rebuild exposure.
● Bear Case
Geopolitical tensions ease rapidly. The Fed remains credibly focused on inflation, keeping real yields positive and supporting the USD over Gold.
Strategic Marker
One level to monitor is prior resistance, alongside any change in COT positioning.
03
US100/NAS100
Nasdaq 100
TECHNOLOGYDUAL PRESSURERATE AND SUPPLY RISK
+
Why it is a complicated position
The Nasdaq faces immediate pressure from two fronts: Stickier energy-driven inflation forces rates higher for longer, compressing multiples, while trade tensions unsettle the supply chains beneath major tech names.
Why the 10 year yield matters here
When the 10 year Treasury yield holds above 4.5%, the future value of technology earnings must be discounted at a higher rate. AI linked earnings momentum must overpower this valuation headwind.
● Bull Case
Earnings season delivers proof of AI investment generating real revenue. Index components successfully insulate supply chains, and AI capex momentum overrides the macro headwind.
● Bear Case
Energy inflation keeps yields above 4.5%. Multiple compression in high valuation names triggers a broader index decline amid disappointments in AI monetization.
Strategic Marker
S&P 500 at 6,498: a widely watched Fibonacci cluster. A sustained move below this threshold highlights a historically challenging framework for growth equities.
04
USD/CNH
US dollar/offshore Chinese yuan
FXBEIJING READPOLICY PROXY
+
What it tells you
USD/CNH is the cleanest real time read on how Beijing is responding to tariff pressure. A sharp rise suggests China is allowing currency weakness to absorb the costs of trade friction.
Why it matters beyond China
A move in USD/CNH doesn't stay contained. It spills into Asian equities, commodity demand, and broader risk appetite. Deliberate depreciation signals a shift in the global trade environment.
● USD Bull / Yuan Bear
Beijing allows yuan weakness as a deliberate countermeasure. Capital outflows accelerate, and USD safe haven demand reinforces the move.
● Yuan Recovery
Trade negotiations begin and a face saving off ramp is found. PBOC intervention defends the yuan, and the dollar's safe haven premium fades.
Strategic Marker
7.30 on USD/CNH: a sustained move above this has historically been associated with broader risk off moves in Asian markets.
05
US10Y/TNOTE
US 10 year Treasury yield
RATESMACRO PLUMBINGSHAPES EVERYTHING ELSE
+
Why it sits under everything
The 10 year yield shapes mortgage costs, corporate borrowing, and the valuation framework for risk assets globally. When it rises, borrowing becomes more expensive across the entire system.
The Independent Movement Risk
If oil forces the Fed to delay cuts, the 10 year yield could rise regardless of Fed communication. It can tighten financial conditions even before a formal policy shift occurs.
● Rates Fall Case
Oil shock proves transient. Fed maintains guidance and 10 year yields pull back toward 4.0%, relieving pressure on equities and providing support for bonds.
● Rates Rise Case
Sustained oil above US$100 pushes inflation higher. Fed pauses rate cut language and the 10 year yield breaks above 4.5%, compressing equity multiples.
Strategic Marker
4.5% on the 10 year yield: a sustained break above this while oil remains above US$100 is a historically challenging combination for equities.
06
USD/CAD
US dollar/offshore Canadian dollar
FXOIL-LINKEDLEAD INDICATOR
+
The Double Exposure
USD/CAD is a lead indicator because Canada sits at the intersection of energy and trade. It benefits from higher oil revenue but is highly sensitive to US economic and trade conditions.
When the Forces Collide
When oil rises, the CAD often strengthens; when trade stress rises, it weakens. In the current environment, these forces are colliding rather than canceling each other out.
● CAD Strengthens
Oil sustained above US$100 boosts export revenue while trade tensions stay short of Canada specific tariffs. Bank of Canada holds rates steady.
● CAD Weakens
Safe haven USD demand outweighs the oil benefit. Bank of Canada cuts rates to offset trade headwinds.
Strategic Marker
1.42 on USD/CAD: a sustained move above this signals trade anxiety is dominating the oil benefit, often preceding broader risk off moves.
What could go wrong
Four reasons the market logic could fail
+
A coherent macro case is still only a case. Markets regularly ignore tidy narratives for longer than expected, or invalidate them quickly. Four failure paths stand out.
1
The situation de-escalates faster than the news cycle suggests
Geopolitical risk premia can build slowly and disappear quickly. Any credible sign of de-escalation, especially around shipping lanes or energy infrastructure, could reverse oil sharply and drain urgency from the rest of the thesis. This is precisely the scenario the TACO framework predicts.
2
Tariff posturing does not become tariff policy
The market may be reacting to opening positions rather than settled policy. If Washington and Beijing find a face-saving off-ramp, as they have in previous trade disputes, currency and equity moves that anticipated escalation could unwind just as fast as they built.
3
AI investment spending overrides the macro headwind
Technology capital expenditure has remained more resilient than expected for much of the past two years. If earnings season shows that AI infrastructure spending is still translating into real demand and returns, the growth narrative may reassert itself, particularly in the Nasdaq 100.
4
The squeeze never arrives: extended positioning holds for longer than expected
Stretched positioning does not automatically produce a violent reprice. Markets can stay under-owned for months if risk appetite remains weak and institutions are unwilling to rebuild exposure. The set-up can exist without the catalyst arriving in a way that forces the move.
Forward Calendar
What to watch and when
+
Three time horizons matter here. The first tests supply resilience. The second tests financial system health. The third tests whether any shift in market leadership is cyclical or structural.
Three horizon watchlist
Signals and catalysts across the next two months
Next Two Weeks
Chipmaker guidance and supply commentary
Major semiconductor earnings calls will offer an early read on whether supply bottlenecks are worsening and whether management teams are changing production assumptions. If supply commentary deteriorates, the inflation story gets another push and the case for higher for longer rates strengthens.
Next 30 Days
Bank earnings and loan demand
Major US banks will provide a useful check on whether capital spending related to AI infrastructure is still being financed. The most important signal may not be earnings per share. It may be commercial loan demand. If businesses are pulling back on borrowing, the growth cycle may be softening earlier than the market expects.
Next 60 Days
Enablers versus spenders
The more structural test is whether the market begins rewarding businesses that produce physical outputs: energy producers, hardware makers and defence contractors, while penalising software companies that still cannot prove a clear return on AI spending. A wider performance gap between those groups would suggest something deeper than a temporary rotation.
O caminho à frente
A atual convergência de tensões geopolíticas e extremos de posicionamento histórico criou um ambiente único de “mola em espiral” para os mercados globais. Enquanto o TACO A estrutura sugere um padrão de forte escalada seguido por pausas estratégicas. O verdadeiro teste para os negociadores nos próximos 60 dias será a transição da volatilidade impulsionada pelas manchetes para a rotação estrutural do mercado.
Quer a lacuna de posicionamento seja fechada por meio de uma leve redução da escalada ou de um violento aperto curto, ter uma estrutura de reação definida pode ajudar os traders a lidar com o ruído.
Market Opportunity
Don't just watch the squeeze. Trade the framework.
As positioning gaps hit decade extremes, access advanced charting tools and real time execution on the six key markets defining this cycle.
Então é o seguinte: a temporada de resultados de abril nos EUA está chegando a um mercado que ainda parece tudo menos normal. Como a GO Markets explica em O manual global de ganhos dos EUA: o guia essencial para comerciantes, esse período de relatório está chegando após uma mudança real no que interessa aos mercados. Não se trata mais apenas de buscar o crescimento a qualquer custo. É sobre o que os números estão dizendo abaixo da superfície.
E em 2026, esses sinais estão colidindo com um cenário de alto atrito:
Conflito geopolítico: Tensão contínua no Oriente Médio
Choque no fornecimento de óleo: Brent bruto acima de USD 100
O Fed: Um banco central ainda preso à inflação persistente
O pivô de durabilidade
Sim, a IA ainda é a história principal do mercado, mas ainda é o mecanismo chamativo que está recebendo a maior parte da atenção. Mas, por baixo disso, há um movimento mais silencioso em direção a empresas que parecem criadas para se manter melhor quando as condições ficam mais difíceis.
Quando as taxas são incertas e os mercados de energia estão sob pressão, nomes como JPMorgan Chase e os principais empreiteiros de defesa começam a ter mais peso. Eles não estão substituindo a narrativa da IA, mas sim se tornando parte da forma como os traders leem o apetite pelo risco, a durabilidade dos lucros e, em última análise, onde o mercado está procurando algo mais sólido em que se agarrar.
!
Important: Reporting schedules can change without notice. Reporting dates and release times are from company investor relations calendars where marked Confirmed; otherwise they are GO Markets estimates. Consensus EPS, revenue and analyst-range data are from third-party market consensus sources, as of 7 April 2026 (AEDT). Company guidance, backlog and operating metrics are from the latest company filings or results presentations unless stated otherwise. Figures and schedules may change without notice.
$JPM| Q1 2026 REPORTING PERIOD
JPMorgan Chase & Co.
NYSE | Financial Services | 14 Apr 2026
Confirmed
Global Release Countdown (BMO)
00:00:00:00
Consensus EPS
US$5.42
Consensus Revenue
US$47.88bn
AU/ASIA14 Apr | 8:45 pm
US/LATAM14 Apr | 6:45 am
Market Intelligence: $JPM
Analysis: JPM price drivers and scenarios
NII guidance
~US$103 billion
Full year | US$95 billionn ex:markets
ROTCE target
17%
Possible return on tangible common equity
Analyst range
US$5.02-5.70
Low to high estimate spread
AVG
LOW US$5.02AVG US$5.39HIGH US$5.70
The analyst spread of US$0.68 signals genuine disagreement about how the rate environment is flowing through to margins. A result above consensus but below the high end estimate may produce a muted reaction. A result above US$5.70 may shift the discussion.
Key swing factors for the result
Net interest income (NII)
The clearest macro lever. It reflects the gap between lending rates and deposit costs.
Guidance: US$103 billion for the full year
Return on tangible common equity (ROTCE)
A scale check. It indicates whether JPM is converting scale into efficiency. 17% is the benchmark.
Target: 17% ROTCE
Trading and investment banking
Strong Q1 growth was expected in fees and markets revenue. These lines can offset softness in lending, and stronger-than-expected performance here may shift the narrative away from rate sensitivity.
Watch: investment banking (IB) fees versus the prior quarter
Expense discipline
A bank can beat the EPS estimate and still sell off if expense growth is running too hot. Pairing the EPS result with the expense trajectory gives a fuller read on whether the beat is durable.
Watch: Expense outlook commentary
Trade Execution: $JPM
Earnings reaction framework: Q1 2026
Bull case
EPS above US$5.70, NII on track | ROTCE at or above 17%
The result comes in above the top of the analyst range. NII guidance holds or is revised higher. IB fees and markets revenue show strong Q1 growth. Expense commentary is constructive.
Possible reaction: momentum and repositioning
Base case
EPS between US$5.39 and US$5.70, NII in line | ROTCE near target
The result beats consensus but stays within the expected range. NII tracks guidance. The tone of the conference call may matter more than the headline number. The first move may fade if guidance is unchanged.
Possible reaction: muted or mixed initial response
Bear case
EPS below US$5.39 | NII misses | Expense growth surprises
The result comes in at or below the consensus midpoint. NII guidance is cut or qualified. Expense growth comes in above market expectations. IB or markets revenue disappoints.
Possible reaction: earnings multiple repricing
Reaction trigger to watch: The market response in the first 30 minutes after the result may indicate which scenario traders are leaning towards. A move above the prior session high on volume may support the bull case. A fade back into the range after an initial pop may point to the base case. A break below the prior session low on volume may suggest the bear case is gaining traction.
Sentiment Analysis · JPMorgan Chase
Interactive scenario analysis: $JPM
Select earnings outcome
Growth momentum
AI-linked offset, beat supported by NII and ROTCE
Stronger-than-expected demand for AI-related industrial lending may offset softer mortgage activity. Management maintains guidance as NII remains resilient in higher-for-longer conditions. IB fees and markets revenue may provide additional support. ROTCE at or above 17% would suggest the bank is converting scale into earnings efficiently.
EPS Outcome
Above US$5.70
NII Signal
On track
ROTCE
At or above 17%
Likely Reaction
Momentum may build
Sources & Data Methodology
Sources: Reporting dates and release times are from company investor relations calendars where marked Confirmed; otherwise they are GO Markets estimates. Consensus EPS, revenue and analyst-range data are sourced from Bloomberg and Earnings Whispers, as at 7 April 2026 (AEDT). Company guidance, backlog and operating metrics are sourced from the latest company filings, results presentations or investor relations materials unless stated otherwise. Any scenario analysis reflects GO Markets analysis. Figures and schedules may change without notice.
From credit to defence
If JPMorgan gives the market an early read on the consumer, credit quality and business activity, the defence names may be telling a different story. This is the point where the focus may start to shift from the credit cycle to government-backed demand.
In a market still shaped by geopolitical risk, that matters. Long-dated programs can help support revenue visibility, even when the broader outlook looks less certain. That is one reason the sector remains on the watchlist.
$LMT| Q1 2026 REPORTING PERIOD
Lockheed Martin Corp.
NYSE | Aerospace | Defense | 22 Apr 2026
Estimated
Global Release Countdown (BMO)
00:00:00:00
Consensus EPS
US$6.50
Consensus Revenue
US$16.32bn
AU | ASIA22 Apr | 9:20 pm
US | LATAM22 Apr | 7:20 am
Market Intelligence: $LMT
Analysis: LMT price drivers and scenarios
Order backlog
US$194 billionn
Record visibility
Book-to-bill
1.2x
Orders outpacing sales
Analyst range
US$6.90-7.10
Low to high estimate spread
AVG
LOW ~US$6.90AVG ~US$6.94HIGH US$7.10+
The consensus sits near the lower end of the analyst range. That positioning may leave room for upside if backlog growth and F-35 delivery timelines support execution. A print near the high end, above US$7.10, may extend the move, although the reaction would still depend on guidance and margins.
Key swing factors for the result
Backlog visibility
Primary evidence of demand. Book-to-bill above 1.2x would support full-year guidance and the production ramp.
Backlog: US$194 billion record
Free cash flow (FCF)
Defence stocks are often assessed on cash conversion. The market may look for confirmation of the US$6.5 billion floor.
Guide: US$6.5 billion - $6.8 billion
Missile segment growth
PrSM and THAAD deliveries remain key watchpoints. Strong space margins may help offset softness in aeronautics.
Watch: Fire Control margins
Margin pressure
Pension charges and production inflation remain risks. An earnings beat may fade if operating margins contract.
The result clears the upper half of the analyst range. Management reaffirms or raises the full-year FCF outlook. Strong Missiles and Fire Control (MFC) margins help offset any aeronautics supply chain lag.
Possible reaction: momentum may build and positioning may improve
Base case
EPS between US$6.30 and US$6.70 | Backlog steady at about US$194 billion
The result aligns with the US$6.38 consensus. F-35 delivery pace remains on track but offers no meaningful upside surprise. The market may wait for more specific segment guidance on the conference call.
Possible reaction: muted or mixed initial response
The result falls towards the bottom of the analyst spread. Management cites further software delays or program losses. The FCF trajectory narrows towards the lower end of previous expectations.
Possible reaction: the share price may come under pressure
Reaction trigger to watch: The market response in the first 30 minutes after the result may indicate which scenario traders are leaning towards. A move above the prior session high on volume may support the bull case. A fade back into the range after an initial pop may point to the base case. A break below the prior session low on volume may suggest the bear case is gaining traction.
Sentiment Analysis · Lockheed Martin
Interactive scenario analysis: $LMT
Select earnings outcome
Backlog confirmed
Backlog and FCF confirmation may support continuation
EPS clears the top of the analyst range. Backlog holds at or above US$194 billion and book-to-bill stays above 1.2, which would suggest orders are replenishing faster than revenue is being recognised. FCF guidance holds within the stated range.
EPS outcome
Above US$7.00
Backlog signal
Above US$194 billion
FCF guide
Holds or improves
Likely reaction
Continuation may follow
Sources & Data Methodology
Sources: Reporting dates and release times are from company investor relations calendars where marked Confirmed; otherwise they are GO Markets estimates. Consensus EPS, revenue and analyst-range data are sourced from Bloomberg and Earnings Whispers, as at 7 April 2026 (AEDT). Company guidance, backlog and operating metrics are sourced from the latest company filings, results presentations or investor relations materials unless stated otherwise. Any scenario analysis reflects GO Markets analysis. Figures and schedules may change without notice.
Not all defence names are the same
Lockheed Martin and Northrop Grumman may sit in the same defence bucket, but the market does not always read them the same way. Lockheed is more closely tied to the F-35 and current air combat demand. Northrop is more closely linked to next-generation programs such as the B-21 Raider and Sentinel.
That gives this section its contrast. One is often read through the lens of current defence demand. The other is more closely tied to longer-cycle strategic modernisation.
$NOC| Q1 2026 REPORTING PERIOD
Northrop Grumman Corp.
NYSE | Defense | Space Systems | 23 Apr 2026
Estimated
Global Release Countdown (BMO)
00:00:00:00
Consensus EPS
US$6.12
Consensus Revenue
US$10.24 bn
AU | ASIA23 Apr | 10:30 pm
US | LATAM23 Apr | 8:30 am
Market Intelligence: $NOC
Analysis: NOC price drivers and scenarios
Consensus EPS
US$6.96
Quarterly analyst average
Order Backlog
US$95.7 billion
Record revenue visibility
FY 2026 EPS guide
US$27.40-US$27.90
Full-year 2026 outlook
AVG
LOW ~US$6.90AVG ~US$6.96HIGH US$7.20+
The consensus sits near the lower end of the analyst range. That offers a quick visual for whether the result is merely in line or strong enough to ease the guidance concerns that weighed on the stock after its last update. A result above US$7.20 may shift the conversation more materially.
Key swing factors for the result
Book-to-bill ratio
Currently at 1.10, suggesting orders are still running ahead of revenue recognition. This remains an important signal for multi-year growth visibility in defence.
Watch: 1.10 target
Guidance reset risk
Management’s guidance previously came in below market expectations. The market may be sensitive to any further softening in the 2026 outlook.
Watch: guidance commentary
Program concentration
The B-21 Raider and Sentinel carry outsized execution sensitivity. Updates on production ramp and funding may be the clearest drivers of sentiment for the stock.
Watch: B-21 and Sentinel updates
Capacity investment
Higher capital expenditure (capex) supports the industrial base over the longer term, but it may pressure near-term margins. Watch for signs that current investment is weighing on earnings power.
The result comes in above the cited threshold. Management says B-21 Raider production is ahead of schedule, with improving margins. Sentinel program restructuring costs remain below baseline expectations. International awards lift the book-to-bill ratio above 1.15.
Possible reaction: momentum may improve
Base case
EPS between US$6.00 and US$6.20, backlog steady at about US$95.7 billion
The result is broadly in line with the cited range. FCF targets for 2026 are reaffirmed but not expanded. Market focus shifts to organic sales growth metrics and segment operating margins. The initial reaction may depend on the timing of B-21 milestone payments.
The result lands near the low end of the analyst spread. Management flags higher infrastructure costs for Sentinel or delays in restricted space segment awards. Margin pressure in Aeronautics persists, and the 2026 revenue guide narrows towards the US$43.5 billion floor.
Possible reaction: shares may weaken
Reaction trigger to watch: The market response in the first 30 minutes after the result may indicate which scenario traders are leaning towards. A move above the prior session high on volume may support the bull case. A fade back into the range after an initial pop may point to the base case. A break below the prior session low on volume may suggest the bear case is gaining traction.
Sentiment Analysis · Northrop Grumman
Interactive scenario analysis: $NOC
Select earnings outcome
Stealth momentum
B-21 momentum, stronger execution and FCF support
EPS clears US$6.15. Management confirms a production capacity agreement for the B-21 Raider. Sentinel restructuring reaches Milestone B on schedule. Record backlog visibility and higher FCF guidance towards US$3.5 billion may support broader repositioning.
EPS outcome
Above US$6.15
B-21 Signal
Acceleration
FCF guide
$3.5 billionn range
Likely reaction
Momentum rally
Sources & Data Methodology
Sources: Reporting dates and release times are from company investor relations calendars where marked Confirmed; otherwise they are GO Markets estimates. Consensus EPS, revenue and analyst-range data are sourced from Bloomberg and Earnings Whispers, as at 7 April 2026 (AEDT). Company guidance, backlog and operating metrics are sourced from the latest company filings, results presentations or investor relations materials unless stated otherwise. Any scenario analysis reflects GO Markets analysis. Figures and schedules may change without notice.
Bottom line
In a market shaped by geopolitical risk and shifting rate expectations, companies with visible demand and longer-cycle revenue may continue to attract attention. But sentiment can still turn quickly if valuations are stretched, rate expectations shift again, or tensions in the Middle East ease.
That is why the story still needs to be tested against the numbers, not just the narrative. GO Markets will be analysing more companies throughout this earnings season. For more updates, visit our
earnings page,
follow our social media channels, or check the weekly newsletters.
Your next earnings setup starts here
Stay ahead of major beats, misses, and market surprises. Log in to your terminal, open a new account, or explore our dedicated earnings academy.