市場新聞與洞察
透過專家洞察、新聞與技術分析,助你領先市場,制定交易決策。

4月8日宣布的停火以及围绕45天休战的平行讨论并未解决霍尔木兹海峡的混乱问题。目前,他们已经限制了最坏的情况,但油轮运输量仍处于正常水平的一小部分,伊朗对过境费的需求预示着结构性转变,而不是暂时的转变。
最初的地区冲突已成为全球能源冲击,市场面临的问题不再是霍尔木兹是否受到干扰,而是这种混乱对石油的最低定价产生了多大的永久性影响。
关键要点
- 每天约有2000万桶(桶)的石油和石油产品通常通过伊朗和阿曼之间的霍尔木兹海峡,相当于全球石油消费量的约五分之一,约占全球海运石油贸易的30%。
- 这是流量冲击,不是库存问题。石油市场依赖于持续的吞吐量,而不是静态存储。
- 如果中断持续超过几周,布伦特原油可能会从短期飙升转向更广泛的价格冲击,存在滞胀风险。
- 穿越海峡的油轮运输量从每天约135艘下降到中断高峰期的不到15艘船只,减少了约85%,超过150艘船只停泊、改道或延误。
- 4月8日宣布了为期两周的停火,为期45天的休战谈判正在进行之中。伊朗已分别表示要求对使用该海峡的船只收取过境费,如果正式确定,这将是能源成本的永久地缘政治最低标准。
- 市场已经开始从增长和技术敞口转向能源和国防企业,这反映了人们的观点,即石油价格上涨正在成为结构性成本,而不是暂时的风险溢价。
世界上最关键的石油阻塞点
霍尔木兹海峡每天处理大约2000万桶石油和石油产品,相当于全球石油消费量的20%和全球海运石油贸易的30%左右。由于全球石油需求接近1.04亿桶/日,且剩余产能有限,在最近的升级之前,市场已经处于紧密平衡状态。
该海峡也是液化天然气的重要走廊。2024年,平均每天约有2.9亿立方米的液化天然气通过该路线,约占全球液化天然气贸易的20%,亚洲市场是主要目的地。
国际能源署(IEA)将霍尔木兹描述为世界上最重要的石油运输阻塞点,并指出,即使是部分中断也可能引发价格的大幅波动。布伦特原油已跌破每桶100美元,这既反映了物质紧张,也反映了地缘政治风险溢价的上升。

由于流量减慢,油轮处于空转状态
现在,航运和保险数据实时显示压力。据报道,超过85艘大型原油运输船滞留在波斯湾,而由于运营商重新评估安全和保险,有150多艘船舶停泊、改道或延误。据估计,这将使1.2亿至1.5亿桶原油在海上闲置。
这些量仅代表霍尔木兹正常吞吐量的六到七天,或略高于一天的全球石油消费。
最新的航运和保险数据现在证实,有150多艘船只停泊、改道或延误,高于最初报告的85艘船只。闲置原油的1.3天全球消费保障仍然是约束性制约因素:这是流量冲击,不是储存问题,停火尚未转化为产量的实质性恢复。
建立在流量而不是存储基础上的市场
石油市场在持续波动中运作。炼油厂、石化厂和全球供应链经过调整,可以沿着可预测的海道稳定交付。当流经占全球石油消耗量约五分之一和全球海运石油贸易约30%的阻塞点时,该系统可以在几天之内从平衡变为赤字。
剩余产能主要集中在欧佩克内,估计仅为每天300万至500万桶。这远低于霍尔木兹水流受到严重干扰时面临的风险交易量。
Oil market analysis
How long do idle tankers last?
135M idle barrels — days of cover against each demand benchmark

vs. Strait of Hormuz daily flow (20M bbl/day)
vs. Global oil consumption (104M bbl/day)
vs. US Strategic Petroleum Reserve release (1M bbl/day)
135M
idle barrels on tankers (midpoint of 120–150M range)
~33%
of daily Hormuz flow that is idle storage, not transit
<31 hrs
is all idle storage against global daily consumption
通货膨胀风险和宏观溢出效应
石油冲击的通货膨胀影响通常以波浪形式出现。随着汽油、柴油和电力成本的上涨,燃料和能源价格的上涨可能会迅速提振总体通货膨胀。
随着时间的推移,更高的能源成本可能会流向货运、食品、制造业和服务业。如果混乱持续下去,通货膨胀率上升和增长放缓相结合,可能会增加滞胀环境的风险,使中央银行面临艰难的权衡。
不容易抵消,系统几乎没有松弛
当前局势之所以特别严重,是因为全球体系缺乏松弛。
当处理近2,000万桶/日(约占全球石油消耗量的五分之一)的阻塞点受到损害时,将近1.03亿至1.04亿桶的全球供需几乎没有备用缓冲。估计每天300万至500万桶的剩余产能,主要在欧佩克内部,只能覆盖风险产量的一小部分。
替代路线,包括绕过霍尔木兹的管道和改道运输,只能部分抵消流量的损失,而且通常成本更高,交货时间更长。
底线
在霍尔木兹海峡的过境恢复并被视为可靠安全之前,全球石油流动可能继续受损,风险溢价上升。对于投资者、政策制定者和企业决策者来说,核心问题是石油能否每天不间断地转移到需要去的地方。


Asia-Pacific markets head into the week with Australia’s CPI as the key domestic catalyst, Japan’s month-end inflation and activity data keeping JPY and equities in focus, and China’s official PMI providing an important read on regional growth momentum.
Quick facts
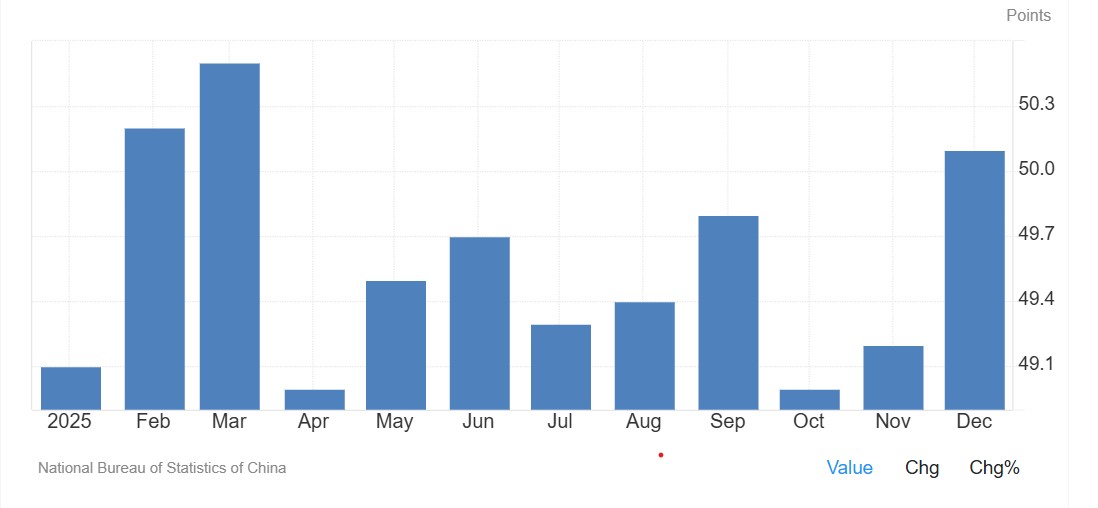
- China: NBS manufacturing PMI rose to 50.1 in December 2025. Consensus for Saturday’s release is 50.2.
- Australia: CPI, Australia (Dec) is the key local catalyst, with implications for rate expectations and AUD pricing.
- Japan: Tokyo CPI and month-end labour/activity data keep USD/JPY and Nikkei futures in focus following last week’s BoJ meeting.
- Global backdrop: US earnings momentum, US CPI expectations and geopolitical developments remain secondary but relevant drivers for Asia-Pacific risk sentiment.
China
Attention turns to China’s official PMI after December’s improvement saw the PMI move back above 50—a level commonly interpreted as expansion in the survey, though month-to-month readings can be volatile.
Consensus suggests a rise to 50.2; if met, it may help reinforce the view that growth momentum is stabilising into early 2026.
Key release
- Sat 31 Jan: NBS manufacturing and non-manufacturing PMI (Jan)
How markets may respond
- Regional equities and risk: Sustained PMI readings above 50 could support broader Asia risk appetite and materials-linked sectors. A reversal below 50 may temper recent optimism.
- AUD spillover: China-sensitive assets, including the AUD and materials stocks on the ASX, may react alongside domestic CPI outcomes.
Japan
Following last week’s BoJ meeting, focus shifts to Tokyo CPI and month-end activity data. These releases late in the week may shape near-term expectations around Japan’s inflation trajectory and the tone of the dataflow.
Key events
- Thu 29 Jan: Tokyo CPI (Jan) (medium sensitivity)
- Fri 30 Jan: Japan unemployment (Dec), retail sales (Dec), industrial production (Dec) (medium sensitivity)
How markets may respond
- USD/JPY: Month-end inflation and activity data can drive front-end rate repricing, with USD/JPY remaining a key transmission channel.
- JP225 (Nikkei futures): The contract has recently traded in a defined range. Market participants may monitor the ~54,250 area on the upside and ~52,250 on the downside as reference points, with price action around these levels often used to gauge whether the range is persisting.
Australia
Australia’s week is dominated by the CPI release. The outcome may influence rate expectations, with the next scheduled RBA decision still in the balance.
ASX 30 Day Interbank Cash Rate Futures imply around a 56% probability of a cash-rate increase at the next scheduled RBA decision (implied pricing can change quickly and is not a forecast).
AUD pricing is likely to remain sensitive alongside broader global risk conditions.
Key release
- Wed 28 Jan: CPI, Australia (Dec) (high sensitivity)
How markets may respond
- ASX 200: Rate-sensitive sectors may react more to the policy implications than the headline CPI number, particularly given recent strength in materials.
- AUD/USD: CPI outcomes may influence whether AUD/USD sustains around/above its current zone or drifts back toward prior trading ranges.

Expected earnings date: Wednesday, 28 January 2026 (US, after market close) / early Thursday, 29 January 2026 (AEDT)
Key areas in focus
The Tesla earnings release can act as a barometer for both global EV demand and capital-intensive innovation across automation and energy systems.
Vehicle deliveries and margins are likely to be the primary near-term drivers of sentiment. Investors will also be watching updates across adjacent initiatives that may influence longer-term growth expectations.
Autonomy and software (FSD)
Tesla’s “Full Self-Driving” (FSD) is a branded advanced driver-assistance feature sold in some markets and requires active driver supervision; availability and capabilities vary by jurisdiction.
Further rollout and any expansion of autonomy-linked services remain subject to regulatory approvals and continued evolution of the underlying technology.
Energy generation and storage
Solar, Powerwall and Megapack remain a key focus, particularly given the segment’s recent growth contribution.
Robotics (Optimus)
Optimus remains early stage, with no disclosed revenue contribution to date. It may become more relevant to Tesla’s longer-term AI and automation aspirations.
Expectations remain delicately balanced between near-term margin pressure, the impact of demand and interest rate movements, and longer-term product and platform developments.
What happened last quarter?
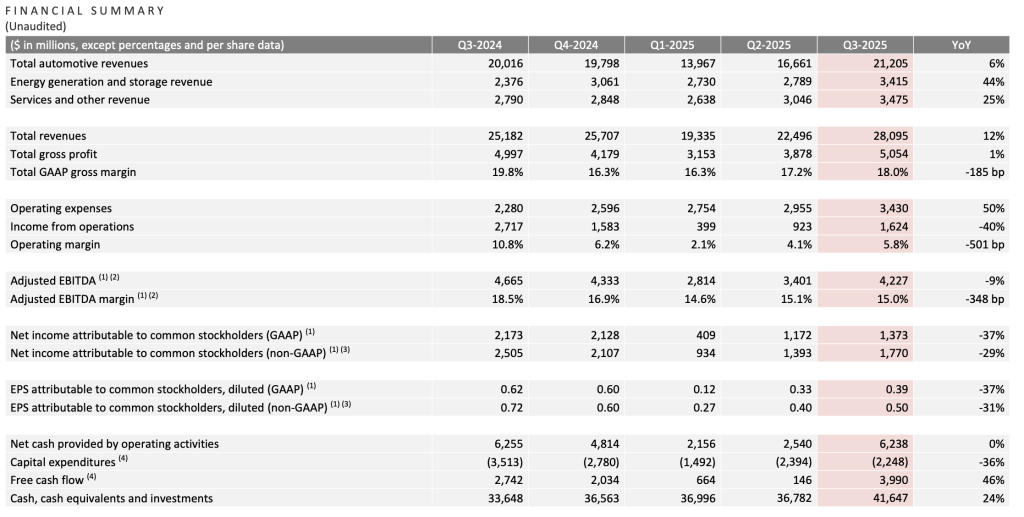
In Q3 2025 (September quarter), Tesla reported mixed results versus consensus expectations. Revenue and deliveries reached record levels, while earnings and margins remained under pressure amid pricing and cost dynamics.
Tesla said it was navigating a challenging pricing environment while continuing to invest for long-term growth (as referenced in the shareholder communications cited below).
Last earnings key highlights
- Revenue: ~US$28.1 billion
- Earnings per share (EPS): ~US$0.50 (non-GAAP, diluted)
- Total GAAP gross margin: ~18.0%;
- Operating margin: ~5.8%
- Free cash flow (FCF): ~US$4.0 billion
- Vehicle deliveries: ~497,099 units, up ~7% year on year (YoY)
How did the market react last time?
Tesla shares were volatile in after-hours trading, with attention focused on margins relative to revenue.
What’s expected this quarter?
As of mid-January 2026, third-party consensus estimates (Bloomberg) indicated continued focus on revenue growth alongside profitability and margin resilience. These are third-party estimates, not company guidance, and can change.
Key consensus reference points include:
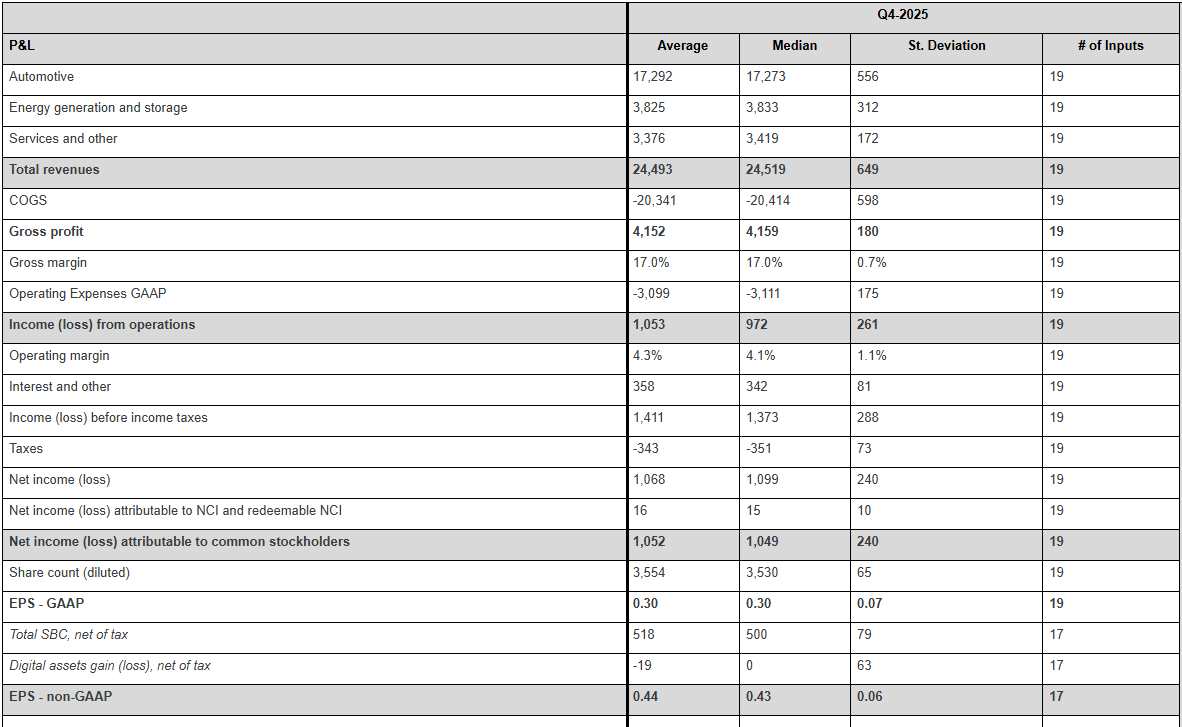
- Revenue: market expectations ~US$27 billion to US$28 billion
- EPS: consensus clustered near US$0.55 to US$0.60 (adjusted)
- Deliveries: market estimates ~510,000 to 520,000 vehicles
- Margins: focus on whether automotive gross margin stabilises near recent levels or trends lower
- Capital expenditure (capex): focus on spending discipline and efficiency rather than acceleration
*All above points observed as of 16 January 2026.
Key areas markets often focus on include:
- Profit margin trajectory, and whether cost efficiencies are offsetting pricing pressure
- Delivery volumes relative to consensus expectations
- Pricing strategy and evidence of demand elasticity across regions
- Capex and implications for future FCF
- Progress in energy storage and non-automotive revenue streams
- Commentary on AI, autonomy and longer-term investment priorities
Expectations
Market sentiment could be described as cautiously optimistic, with investors weighing revenue momentum against margin concerns.
Price has pulled back into a range following a brief test of recent highs in December. Given the recent range-bound price action, deviations from consensus across key earnings metrics may prompt a larger move in either direction.
Listed options were pricing an indicative move of around ±5.5% based on near-dated options expiring after 28 January and an at-the-money (ATM) options-implied expected move estimate.
Implied volatility (IV) was about 47.7% annualised into the event, as observed on Barchart at 11:30 am AEDT on 16 January 2026 (local time of observation).
These are market-implied estimates and may change. Actual post-earnings moves can be larger or smaller.
What this means for Australian traders
Tesla’s earnings may influence near-term sentiment across US growth and technology indices, with potential flow-through to broader risk appetite.
For Australian markets, any read-through is often framed through supply chain sensitivity. Market participants may look to related sectors such as lithium and rare earth producers linked to EV inputs are one potential channel, alongside broader sentiment impacts from Tesla’s innovation commentary.
Important risk note
Immediately after the US close and into the early Asia session, Nasdaq 100 (NDX) futures and related CFD pricing can reflect thinner liquidity, wider spreads, and sharper repricing around new information.
Such an environment can increase gap risk and execution uncertainty relative to regular-hours conditions.

Expected earnings date: Wednesday, 28 January 2026 (US, after market close) / early Thursday, 29 January 2026 (AEDT)
Key areas in focus
Intelligent Cloud (Azure)
Azure remains Microsoft’s primary earnings swing factor. Markets are watching to see whether any growth reflects demand strength or capacity constraints, and how AI-related workloads are impacting margins.
Productivity and Business Processes
Microsoft 365, Office, and LinkedIn are sources of recurring revenue for Microsoft. Growth, pricing discipline, and client churn remain the key variables that markets will be watching.
Personal Computing
Windows, devices, and gaming are more cyclical. Stabilisation of PC demand and gaming engagement remain secondary sources of revenue but are still noteworthy.
Artificial intelligence
Approaches around the monetisation of Microsoft’s AI play are still developing. Trends in enrolment and infrastructure cost are expected to be key factors.
What happened last quarter
Microsoft reported results ahead of consensus, supported by steady cloud demand and resilient enterprise software revenues.
Azure and other cloud services' growth remained a central focus, alongside commentary on AI-related investment and capacity.
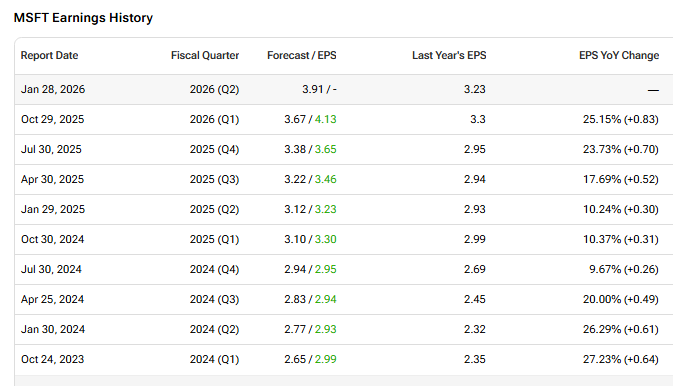
Last earnings key highlights:
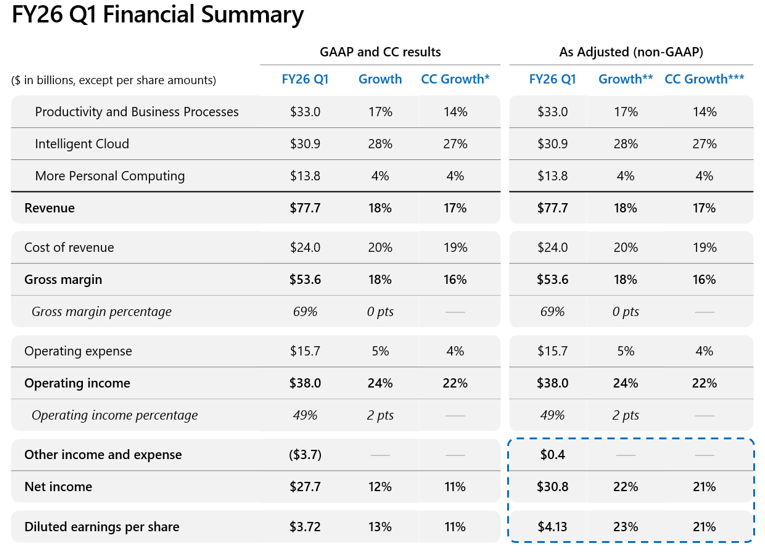
- Revenue: US$77.7 billion
- Earnings per share (EPS): US$3.72 (GAAP) and US$4.13 (non-GAAP adjusted)
- Intelligent Cloud revenue: US$30.9 billion
- Azure and other cloud services: up 40% year on year
- Operating income: US$38.0 billion
How the market reacted last time
Microsoft shares fell in after-hours trading following the release, despite the beating of headline numbers, as investors focused on AI investment intensity, capacity constraints and related implications for future margins.
What’s expected this quarter
Bloomberg consensus points to continued revenue growth led by cloud services, alongside broadly stable margins despite elevated capex.
Bloomberg consensus reference points (January 2026):
- Revenue: about US$68 to US$69 billion
- EPS: about US$3.10 to US$3.20 (adjusted)
- Azure growth: mid-to-high 20% year on year (YoY) (constant currency)
- Operating margin: expected to remain broadly stable
- Capex: expected to remain elevated, reflecting AI and cloud build-out
*All above points observed as of 16 January 2026.
Expectations
Sentiment appears cautious. Microsoft can remain sensitive to any cloud, margin, or guidance disappointment, particularly where investors interpret investment intensity as open-ended.
Price action traded within an established range of US$472 and US$490 recently, but has moved below this in the last week.
Listed options were pricing an indicative move of around ±2% based on near-dated options expiring after 28 January and an at-the-money options-implied ‘expected move’ estimate.
Implied volatility was about 33.5% annualised into the event as observed on Barchart at 11:00 AEDT on 16th January 2026.
These are market-implied estimates and may change; actual post-earnings moves can be larger or smaller.
What this means for Australian traders
Microsoft’s earnings may influence near-term sentiment across US technology indices, particularly the Nasdaq, with potential spillover into global equity risk appetite and, in turn, the ASX.
As a major technology stock, and with Tesla (TSLA) also scheduled to report after the US close on the same day, volatility in Nasdaq-linked products may increase while futures markets remain open.
Important risk note
Immediately after the US close and into the early Asia session, Nasdaq 100 (NDX) futures and related CFD pricing can reflect thinner liquidity, wider spreads, and sharper repricing around new information.
Such an environment can increase gap risk and execution uncertainty relative to regular-hours conditions.

Expected earnings date: Wednesday, 28 January 2026 (US, after market close) / early Thursday, 29 January 2026 (AEDT)
Key areas in focus
Advertising (Family of Apps)
Advertising remains Meta’s dominant revenue driver. AI-driven ad targeting, Reels monetisation, and engagement efficiency can be important contributors to revenue growth and may support advertiser outcomes, noting results can vary by advertiser, format, and market conditions.
User engagement and monetisation
Engagement trends across Facebook, Instagram, WhatsApp, and Threads remain closely watched as indicators that can influence monetisation assumptions and medium-term expectations.
Artificial intelligence
Meta views AI as a foundation for content discovery, advertising performance, and the development of generative tools. Markets may continue to evaluate whether AI-driven gains offset the level of infrastructure and data centre investment required to support these projects.
Reality Labs
Reality Labs remains loss-making. Management continues to frame AR/VR and metaverse-related platforms as long-term strategic investments, while acknowledging continued operating losses and a drag on earnings performance.
What happened last quarter
Meta’s most recent quarterly update highlighted strong revenue growth alongside ongoing investment themes.
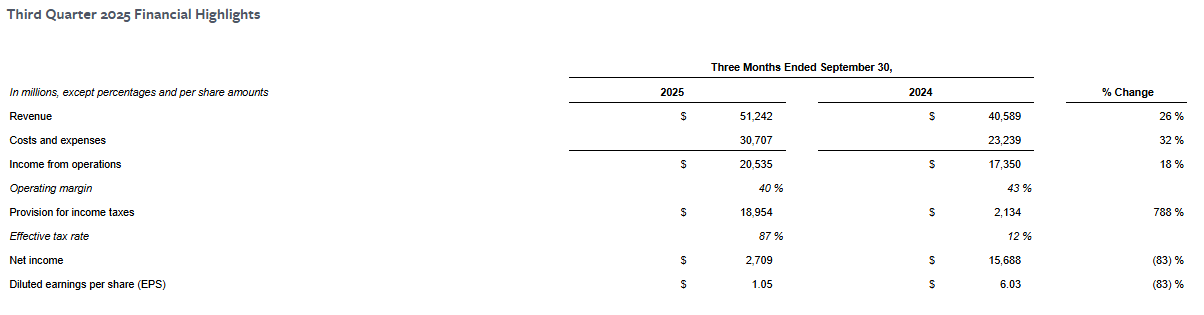
The company’s reported (GAAP) net income and EPS reflected a one-time, non-cash income tax charge disclosed in the earnings materials, while management commentary also emphasised cost discipline and investment priorities.
Operating margins expanded year-on-year, despite elevated AI-related investment.
Last earnings key highlights
- Revenue: US$51.24 billion
- Earnings per share (EPS): US$1.05 (GAAP)
- Advertising revenue: US$50.08 billion
- Operating margin: 40%
- Reality Labs operating loss: about US$4.43 billion
How the market reacted last time
Meta shares fell in after-hours trading after the release. Commentary at the time highlighted strong top-line outcomes, alongside investor focus on the outlook for spending and the pace of AI and infrastructure investment.
What’s expected this quarter
Bloomberg consensus points to continued year-on-year revenue growth, led by advertising, with operating margins expected to remain elevated despite ongoing AI and infrastructure expenditure.
Bloomberg consensus reference points (January 2026)
- Revenue: about US$41 to US$43 billion
- EPS: about US$4.80 to US$5.10 (adjusted)
- Advertising growth: high-teens year on year (YoY)
- Operating margin: expected to remain above 40%
- Capital expenditure (capex): elevated, reflecting AI and data centre investment
*All above points observed as of 23 January 2026.
Expectations
Sentiment around Meta Platforms may be sensitive to any disappointment around advertising demand, margin sustainability, or the scale of ongoing investment in AI and Reality Labs.
Recent price action suggests that some market participants appear to be pricing in a relatively constructive earnings outcome, which can increase sensitivity to negative surprises.
Listed options were pricing an indicative move of around ±3% based on near-dated options expiring after 28 January and an at-the-money options-implied ‘expected move’ estimate.
Implied volatility was about 31% annualised into the event, as observed on Barchart at 11:00 am AEDT on 23 January 2026.
These are market-implied estimates and may change. Actual post-earnings moves can be larger or smaller.
What this means for Australian traders
Meta’s earnings may influence near-term sentiment across US technology indices, particularly the Nasdaq, with potential spillover into broader global equity risk appetite and index-linked products traded during the Asia session after the release, which can be volatile and unpredictable following earnings events.
Important risk note
Immediately after the US close and into the early Asia session, Nasdaq 100 (NDX) futures and related CFD pricing can reflect thinner liquidity, wider spreads, and sharper repricing around new information.
Such an environment can increase gap risk and execution uncertainty relative to regular-hours conditions.

Australian CPI may test market pricing for a February RBA move, while the Federal Reserve narrative will be followed closely, even though a pause is widely expected. It is also a busy US earnings week, with mega-cap names headlining, and Gold remains a key market focus.
- Australia CPI: Australian CPI is the key domestic release, with markets pricing the risk of a February RBA rate increase.
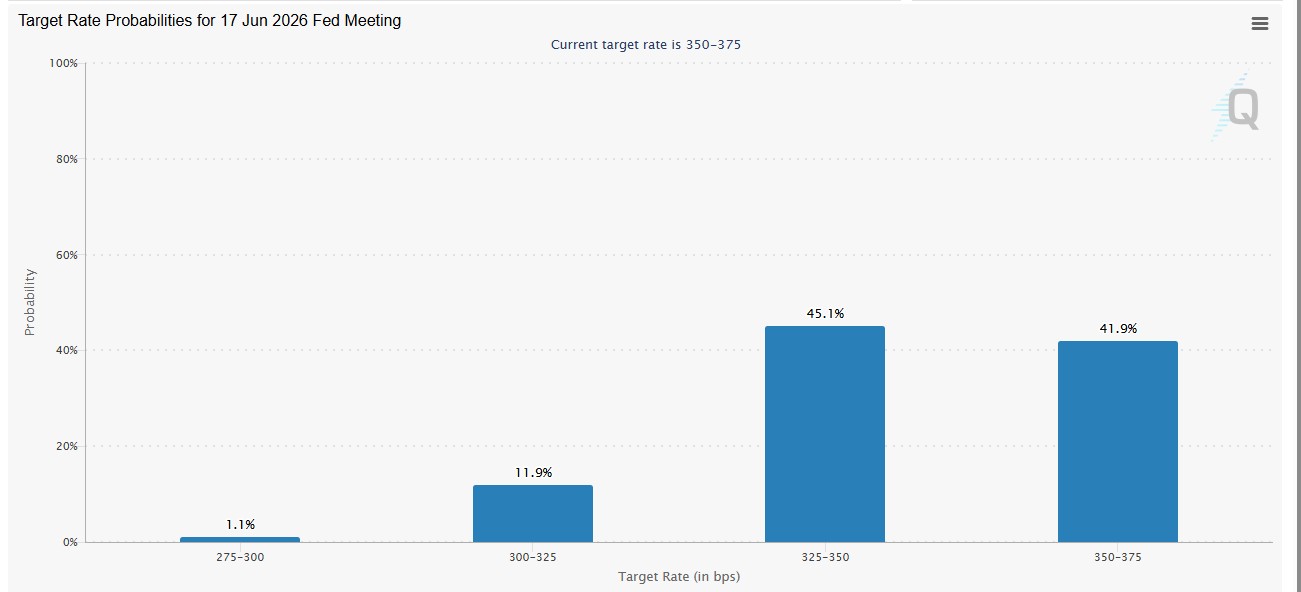
- US Federal Reserve: The Fed is widely expected to hold rates steady, with attention on whether a potential June rate cut remains intact.
- US mega-cap tech earnings: Earnings from large-cap technology names may test whether current equity valuations remain supported.
- Gold: Gold continues to trade near record highs.
Australia
- Australia CPI (Q4): Wednesday, 28 January
Stronger-than-expected jobs report this week lifted market expectations for further policy tightening.
According to the ASX RBA Rate Tracker, market-implied pricing for a February rate increase has risen to above 60%.
Market impact
- AUD crosses may respond to any shift in rate expectations
- Rate-sensitive equity sectors could see follow-through moves
Federal Reserve
- FOMC rate decision: Wednesday, 28 January (US) | 29 January (AEDT)
The Federal Reserve is widely expected to announce no change in rates after its two-day meeting.
Market focus will centre on communication around inflation progress, and whether market-implied pricing for a potential June rate cut is reinforced or challenged.
Market impact
- USD direction may respond to any shift in policy tone across multiple asset classes
- US Treasury yields, especially at the front end, may react to changes in rate expectations
US mega-cap earnings
- Boeing: 27 January (US time) | 28 January AEDT
- Microsoft: 28 January (US time, after market close) | 29 January AEDT
- Meta Platforms: 28 January (US time, after market close) | 29 January AEDT
- Tesla: 28 January (US time, after market close) | 29 January AEDT
- Caterpillar: 29 January (US time, before market open)/30 January AEDT
- Apple: 29 January (US time, after market close) | 30 January AEDT
Earnings from US mega-cap technology companies are likely to dominate headlines, but next week is also one of the busiest periods so far this earnings season across multiple sectors.
Markets are likely to focus on guidance, margins and capital expenditure as much as the headline results.
Market impact
- Nasdaq leadership breadth may respond to guidance consistency
- With equity markets remaining generally strong, current valuations will again be tested
- Overall performance across sectors will be viewed as a lens into the state of the econ
(Note: Dates may be subject to change)
Gold
At the US close on 22 January 2026, COMEX gold futures traded around US$4,920/oz, with the psychologically important 5,000 level in view.
Sensitivity to Treasury yields and the USD, policy uncertainty, and geopolitical developments may influence price action either way.
Market impact
- Gold prices can remain sensitive to changes in Treasury yields, USD movements and geopolitical developments.
- Movements around record levels can be volatile and unpredictable, and may reverse quickly.
Final takeaways
- If Australian CPI suggests inflation persistence, market pricing may continue to lean toward a February RBA move
- If the Fed narrative is less dovish than expected, current assumptions may be challenged
- If mega-cap earnings reinforce valuation confidence, leadership from these stocks may help support broader equity levels
- If gold holds near record highs, USD weakness and hedging demand may remain key drivers

US and European market attention this week is centred on the US Personal Income and Outlays report (which includes the PCE price index), late-week flash PMI releases, and a continued ramp-up in the US earnings season.
Alongside key data, geopolitical developments, including renewed discussion around Greenland and tariff threats, remain part of the broader risk backdrop.
Quick facts:
- US PCE inflation: Closely watched by policymakers as an important inflation measure (released within the Personal Income and Outlays report).
- Flash PMIs: US, Eurozone, Germany, and the UK are due late week, offering a read on growth momentum.
- US earnings: Large-cap and index-heavy companies shaping sentiment at elevated index levels.
- Geopolitical headlines: Greenland and proposed tariff measures add a layer of uncertainty to broader risk sentiment.
- Equity indices: Trading at elevated levels, which may increase sensitivity to data and earnings surprises.
United States
What to watch
US markets reopen after the Juneteenth holiday, with the US data calendar featuring the PCE price index and core PCE measures. Outcomes that differ from expectations can influence interest-rate expectations and near-term risk sentiment.
Later in the week, flash PMIs offer a more current snapshot of activity across manufacturing and services. US earnings remain a key driver of sentiment, and with indices at elevated levels, valuation and guidance narratives may be tested as results are released.
Key releases and events
- Thu 22 Jan (US): BEA GDP release — Q3 2025 (Updated Estimate)
- Thu 22 Jan (US): BEA Personal Income and Outlays (Oct & Nov 2025) — includes PCE price index and core PCE
- Fri 23 Jan (US): S&P Global flash PMIs (manufacturing and services)
- Throughout the week: US earnings season continues
How markets may respond
- Equities: Indices have been trading at elevated levels. As of 10:30am AEDT, 20 January 2026, the S&P 500 was within ~50 points of its record high.
- USD: PCE results that differ from expectations can contribute to volatility in FX and USD-linked assets, while PMI data can influence shorter-term momentum.
- Earnings: In a market trading at elevated levels, earnings results and forward guidance can generate volatility even without large headline misses. Forward guidance and margin commentary are likely to be closely watched.
UK and eurozone
What to watch
In the UK, CPI and labour market data can influence rate expectations and perceptions of growth momentum. In Germany, producer price data offers insight into pipeline inflation pressures. Flash PMIs across the Eurozone, Germany, and the UK complete the week’s calendar and may influence near-term growth assessments.
Key releases and events
Eurozone and Germany
- Thu 22 Jan: Germany PPI
- Fri 23 Jan: Eurozone flash manufacturing PMI (with services PMI)
- Fri 23 Jan: Germany flash manufacturing PMI
United Kingdom
- Wed 21 Jan: UK CPI
- Thu 22 Jan: UK labour market report
- Fri 23 Jan: UK flash manufacturing PMI (with services PMI)
How markets may respond
- DAX: The German index has been trading at elevated levels. PMI and PPI outcomes may influence cyclical sectors, notably industrials and exporters.
- FTSE 100 and GBP: UK CPI and labour market data can affect rate expectations and GBP sensitivity, while PMI outcomes may influence sector-level performance within the index.
- EUR: Euro moves may reflect PMI momentum and inflation signals, though direction can still be heavily influenced by US outcomes and global risk sentiment.
Geopolitics
Reporting has focused on renewed discussion around Greenland and associated tariff threats. Reporting also outlines tariff rates and potential escalation timelines, though details and implementation remain subject to change, and the situation is fluid.
Market reaction has been limited so far. If rhetoric escalates, markets could see intermittent volatility across equities, commodities, and FX. safe-haven moves (including in gold) are possible, though reactions can be uneven and may reverse.
US and Europe calendar summary
- Wed 21 Jan: UK CPI
- Thu 22 Jan (US) / Fri 23 Jan(AEDT):
- US GDP (Q3 2025 updated estimate)
- US Personal Income and Outlays (Oct/Nov, includes PCE)
- UK labour market report
- Fri 23 Jan: Flash PMIs (US, Eurozone, Germany, UK)
Bottom line
- The Personal Income and Outlays report (including PCE inflation measures) is one of the key US macro events this week and may influence rate expectations if outcomes differ materially from expectations.
- With equity indices trading at elevated levels, markets may be more sensitive to negative surprises and guidance downgrades than to confirmatory data.
- European releases — particularly UK CPI and the flash PMIs — remain important locally but may still trade in the context of US outcomes and broader risk sentiment.
- Geopolitical developments around Greenland and tariffs remain a secondary but persistent source of uncertainty.